Monitoring
The Monitoring section allows monitoring database servers in real-time.
These are the different resources that can be monitored:
- Dashboard: Monitor server's health and all the events that happened in the past.
- Parameters: Monitor server's parameters and compare it with other servers.
- Processlist: Monitor in real-time all queries that are being executed in a server.
- Queries: Track slow queries to be later analysed.
Dashboard
This section has been developed with a proactive notification system. Every time a server changes its status (available, unavailable, restarted, parameters changed) a notification will be sent to the users that have this server added in their monitoring list.

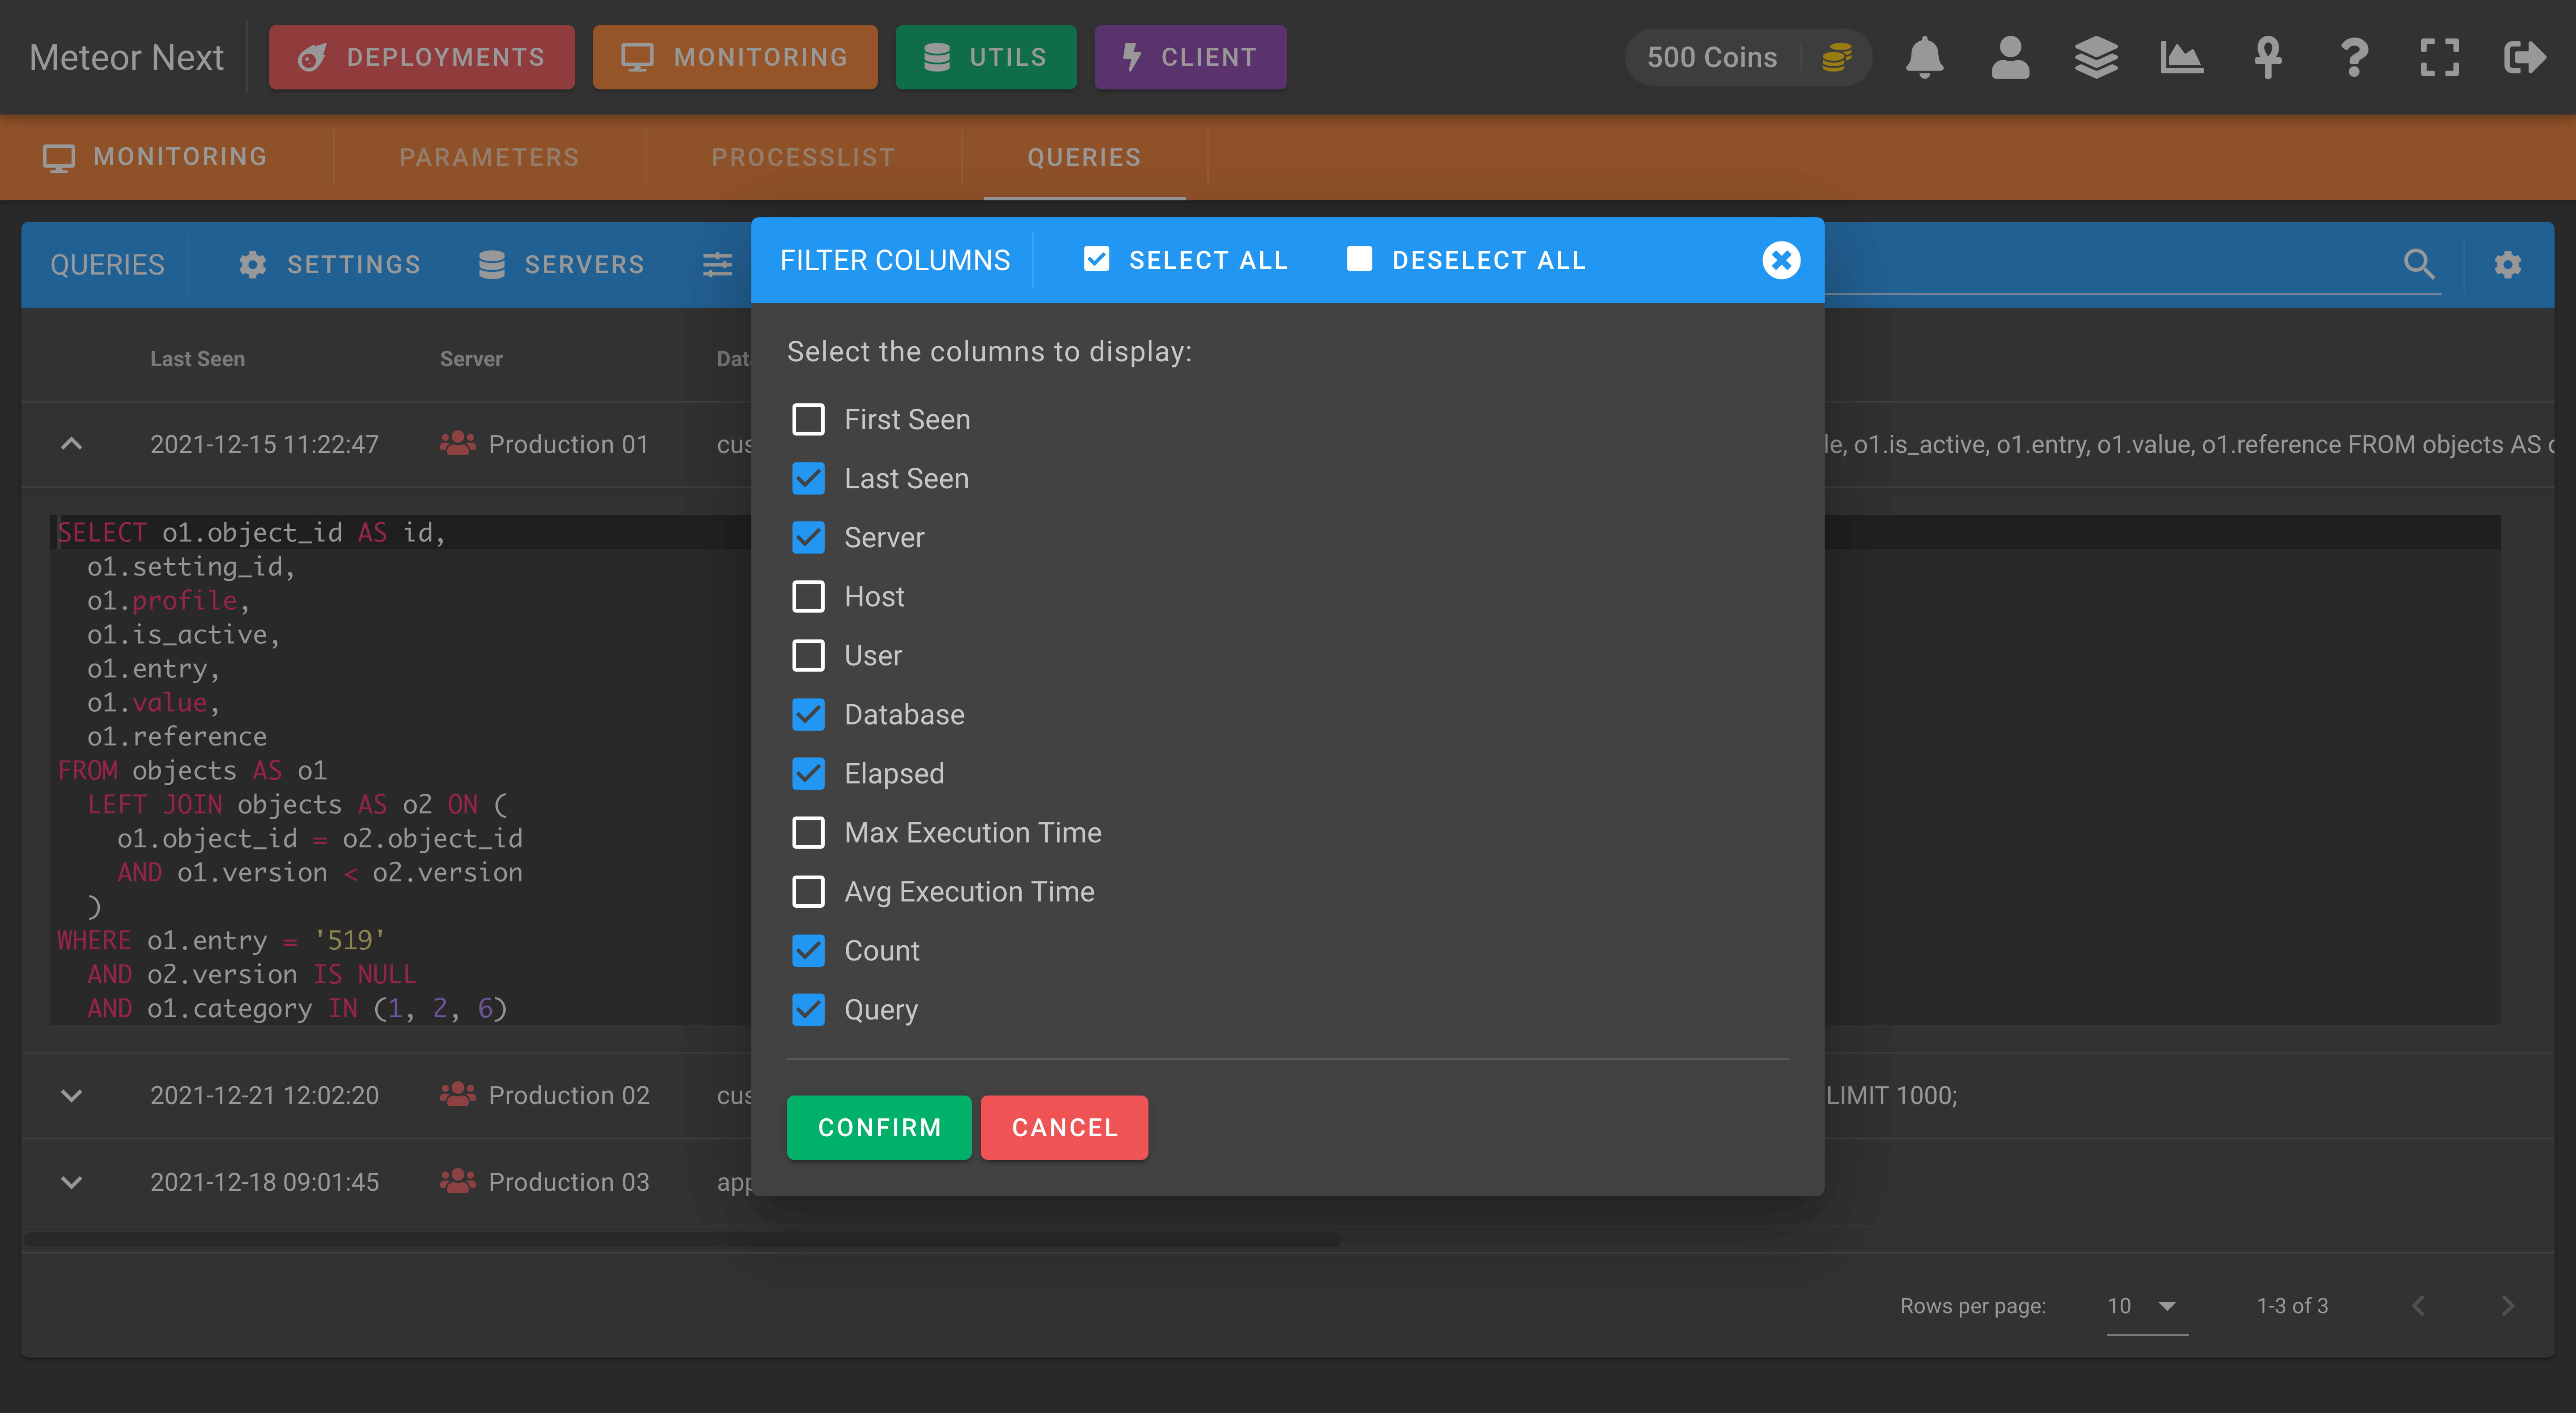
You can also click a server to get further details.
SETTINGS
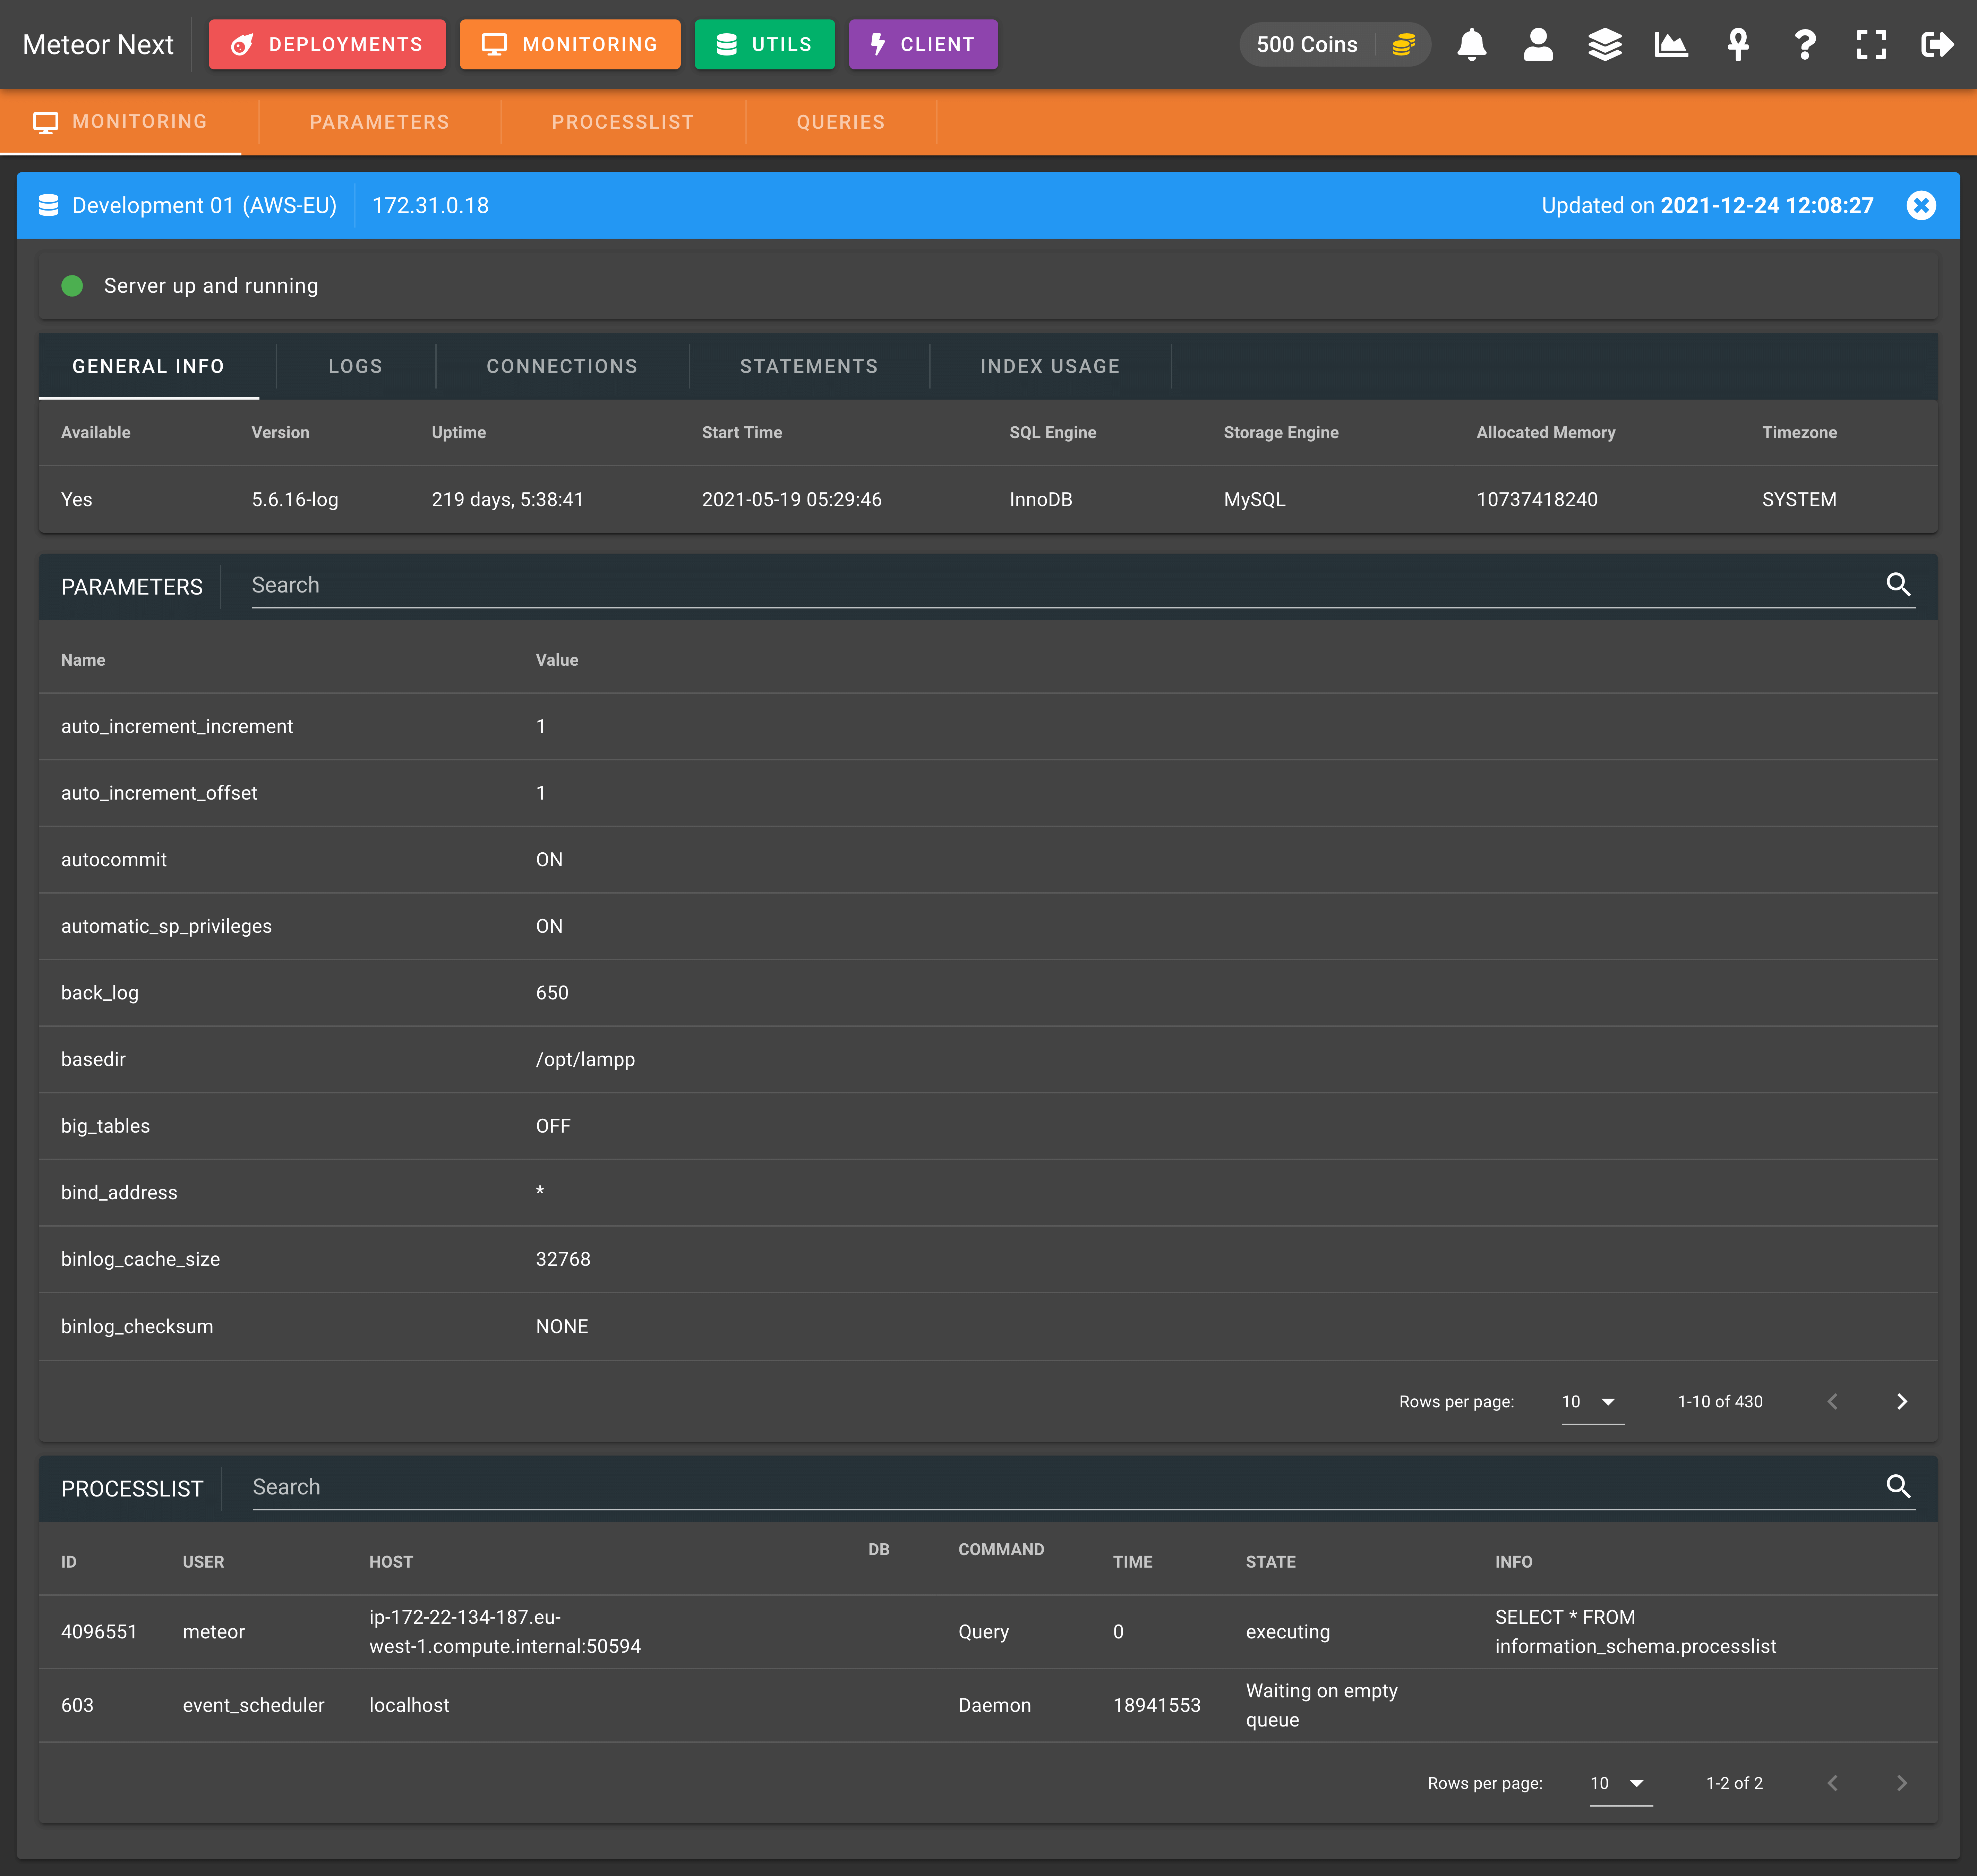
There are some settings that can be defined:
- Servers per line: The amount of servers to be displayed per line.
- Slack Notifications: Enable to receive a Slack message every time a server changes its status (available, unavailable, parameters changed, restart).
SERVERS
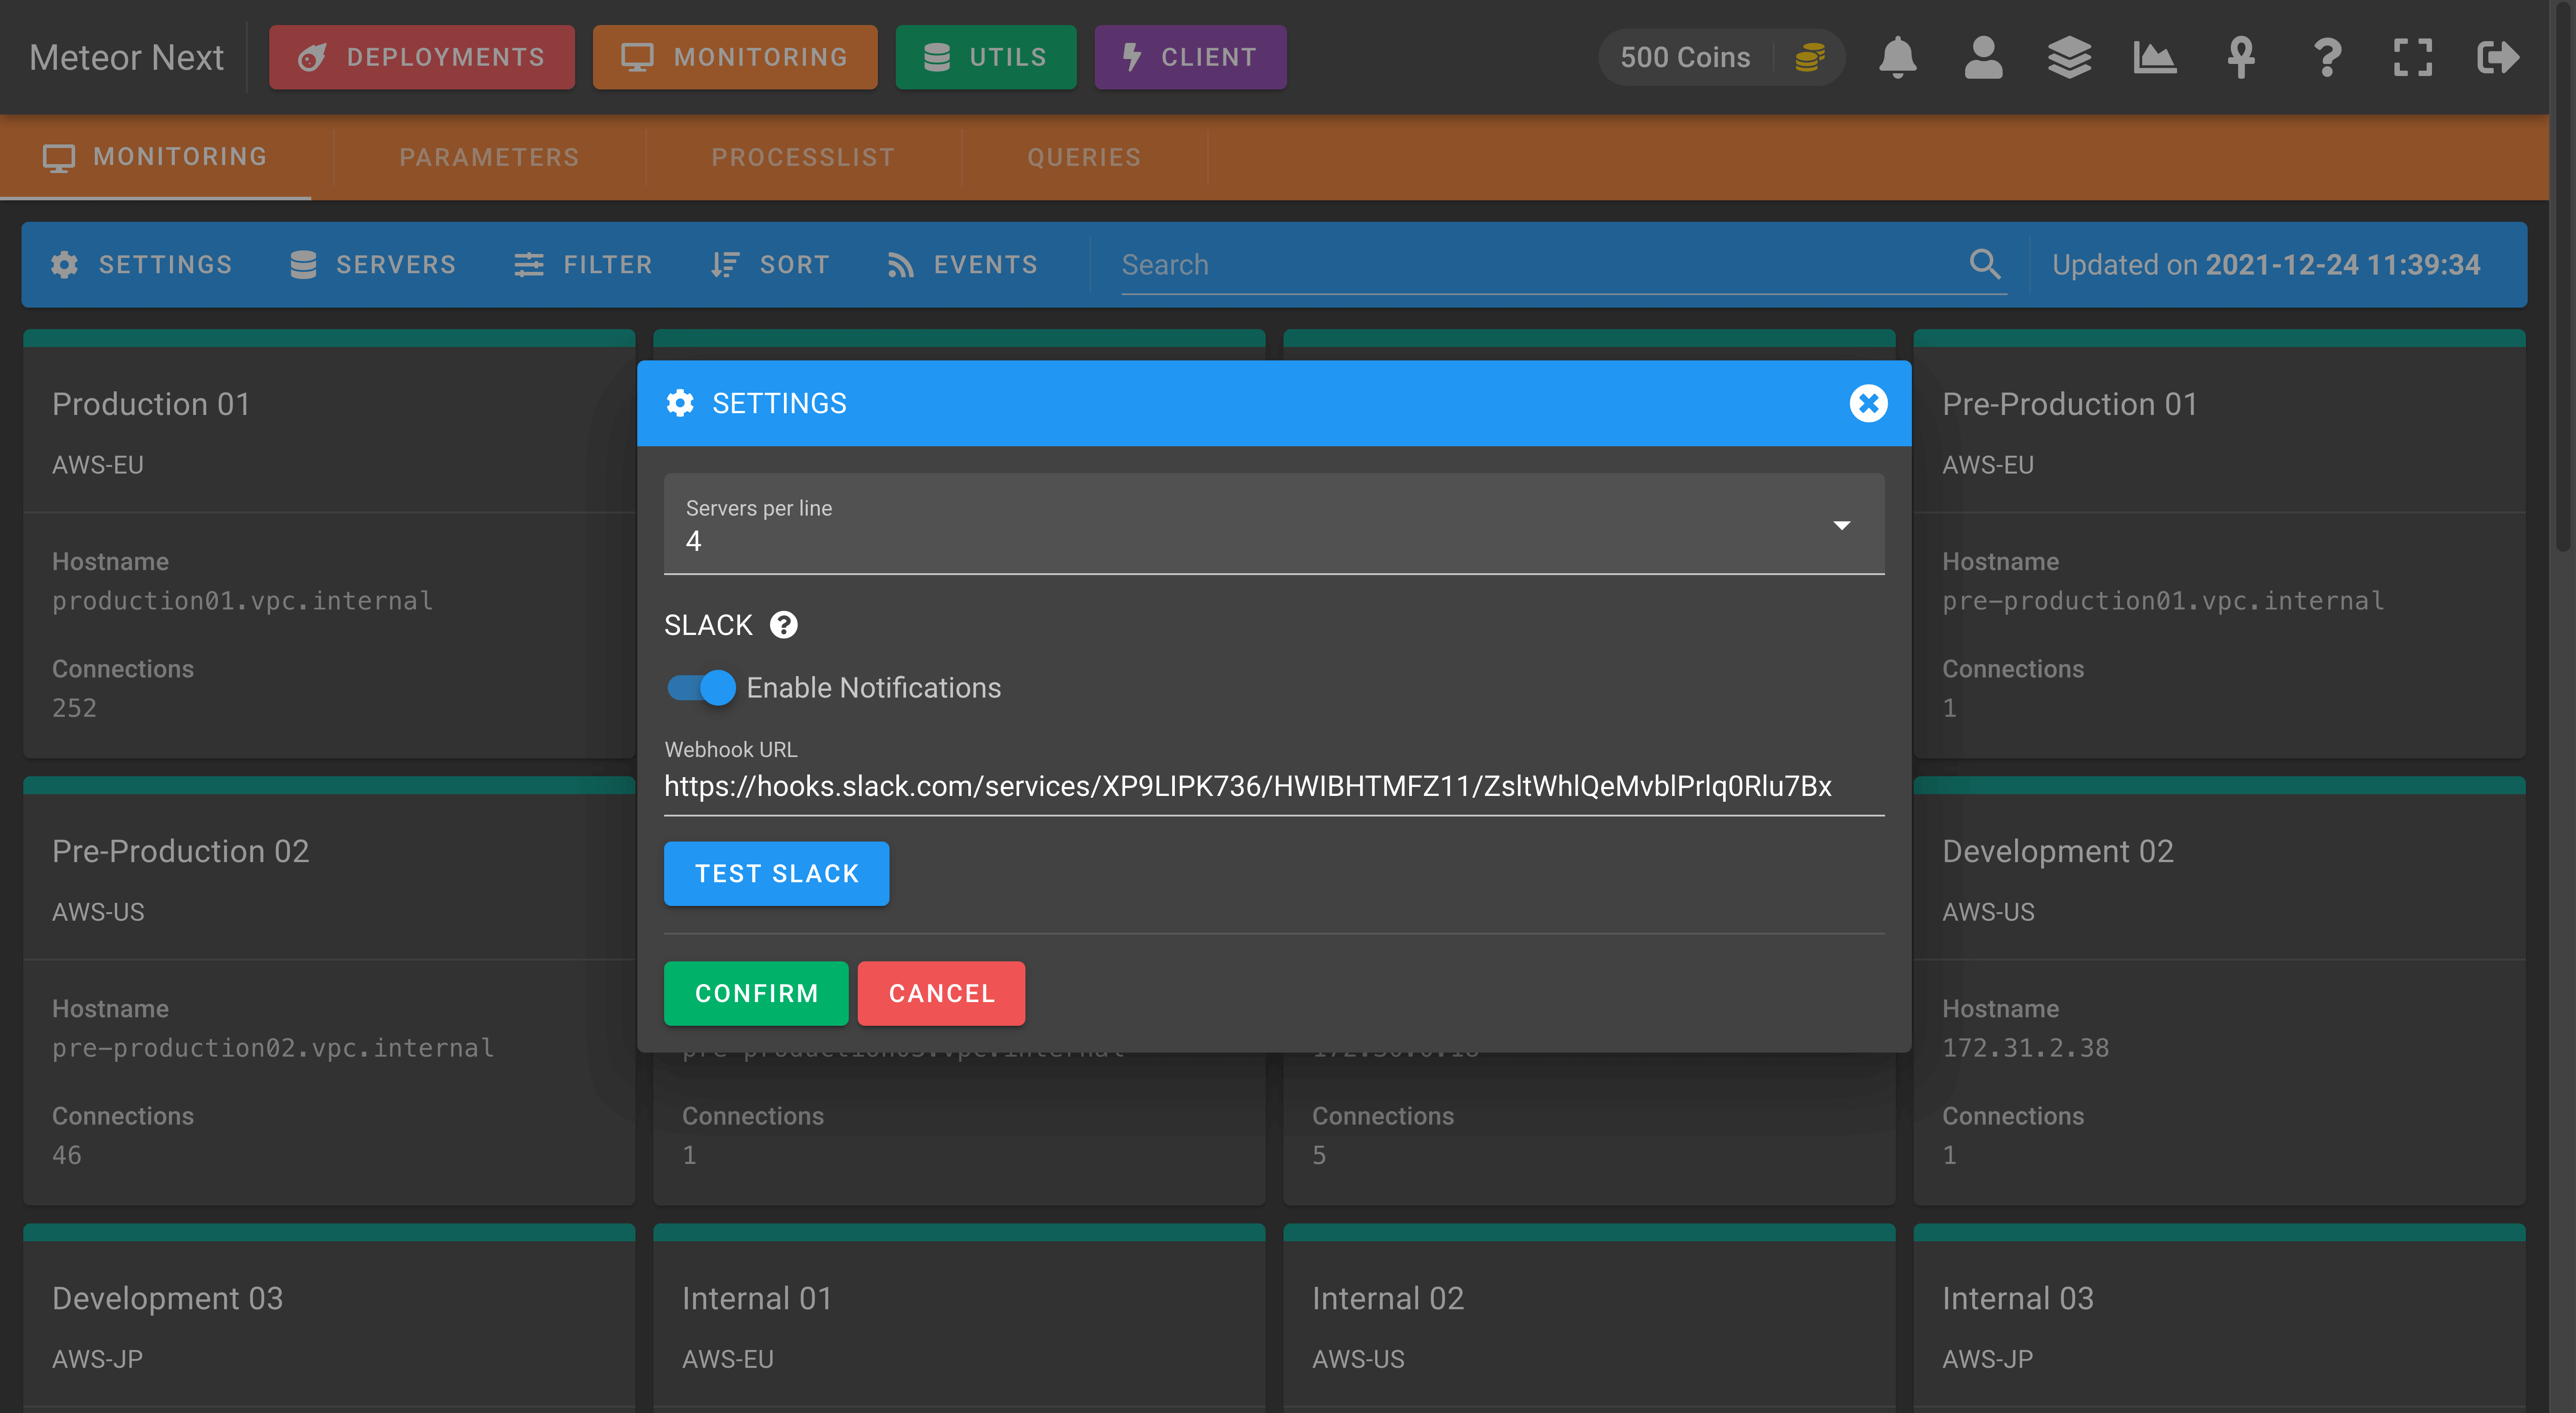
Here, we can select which servers of our inventory have to be monitored.
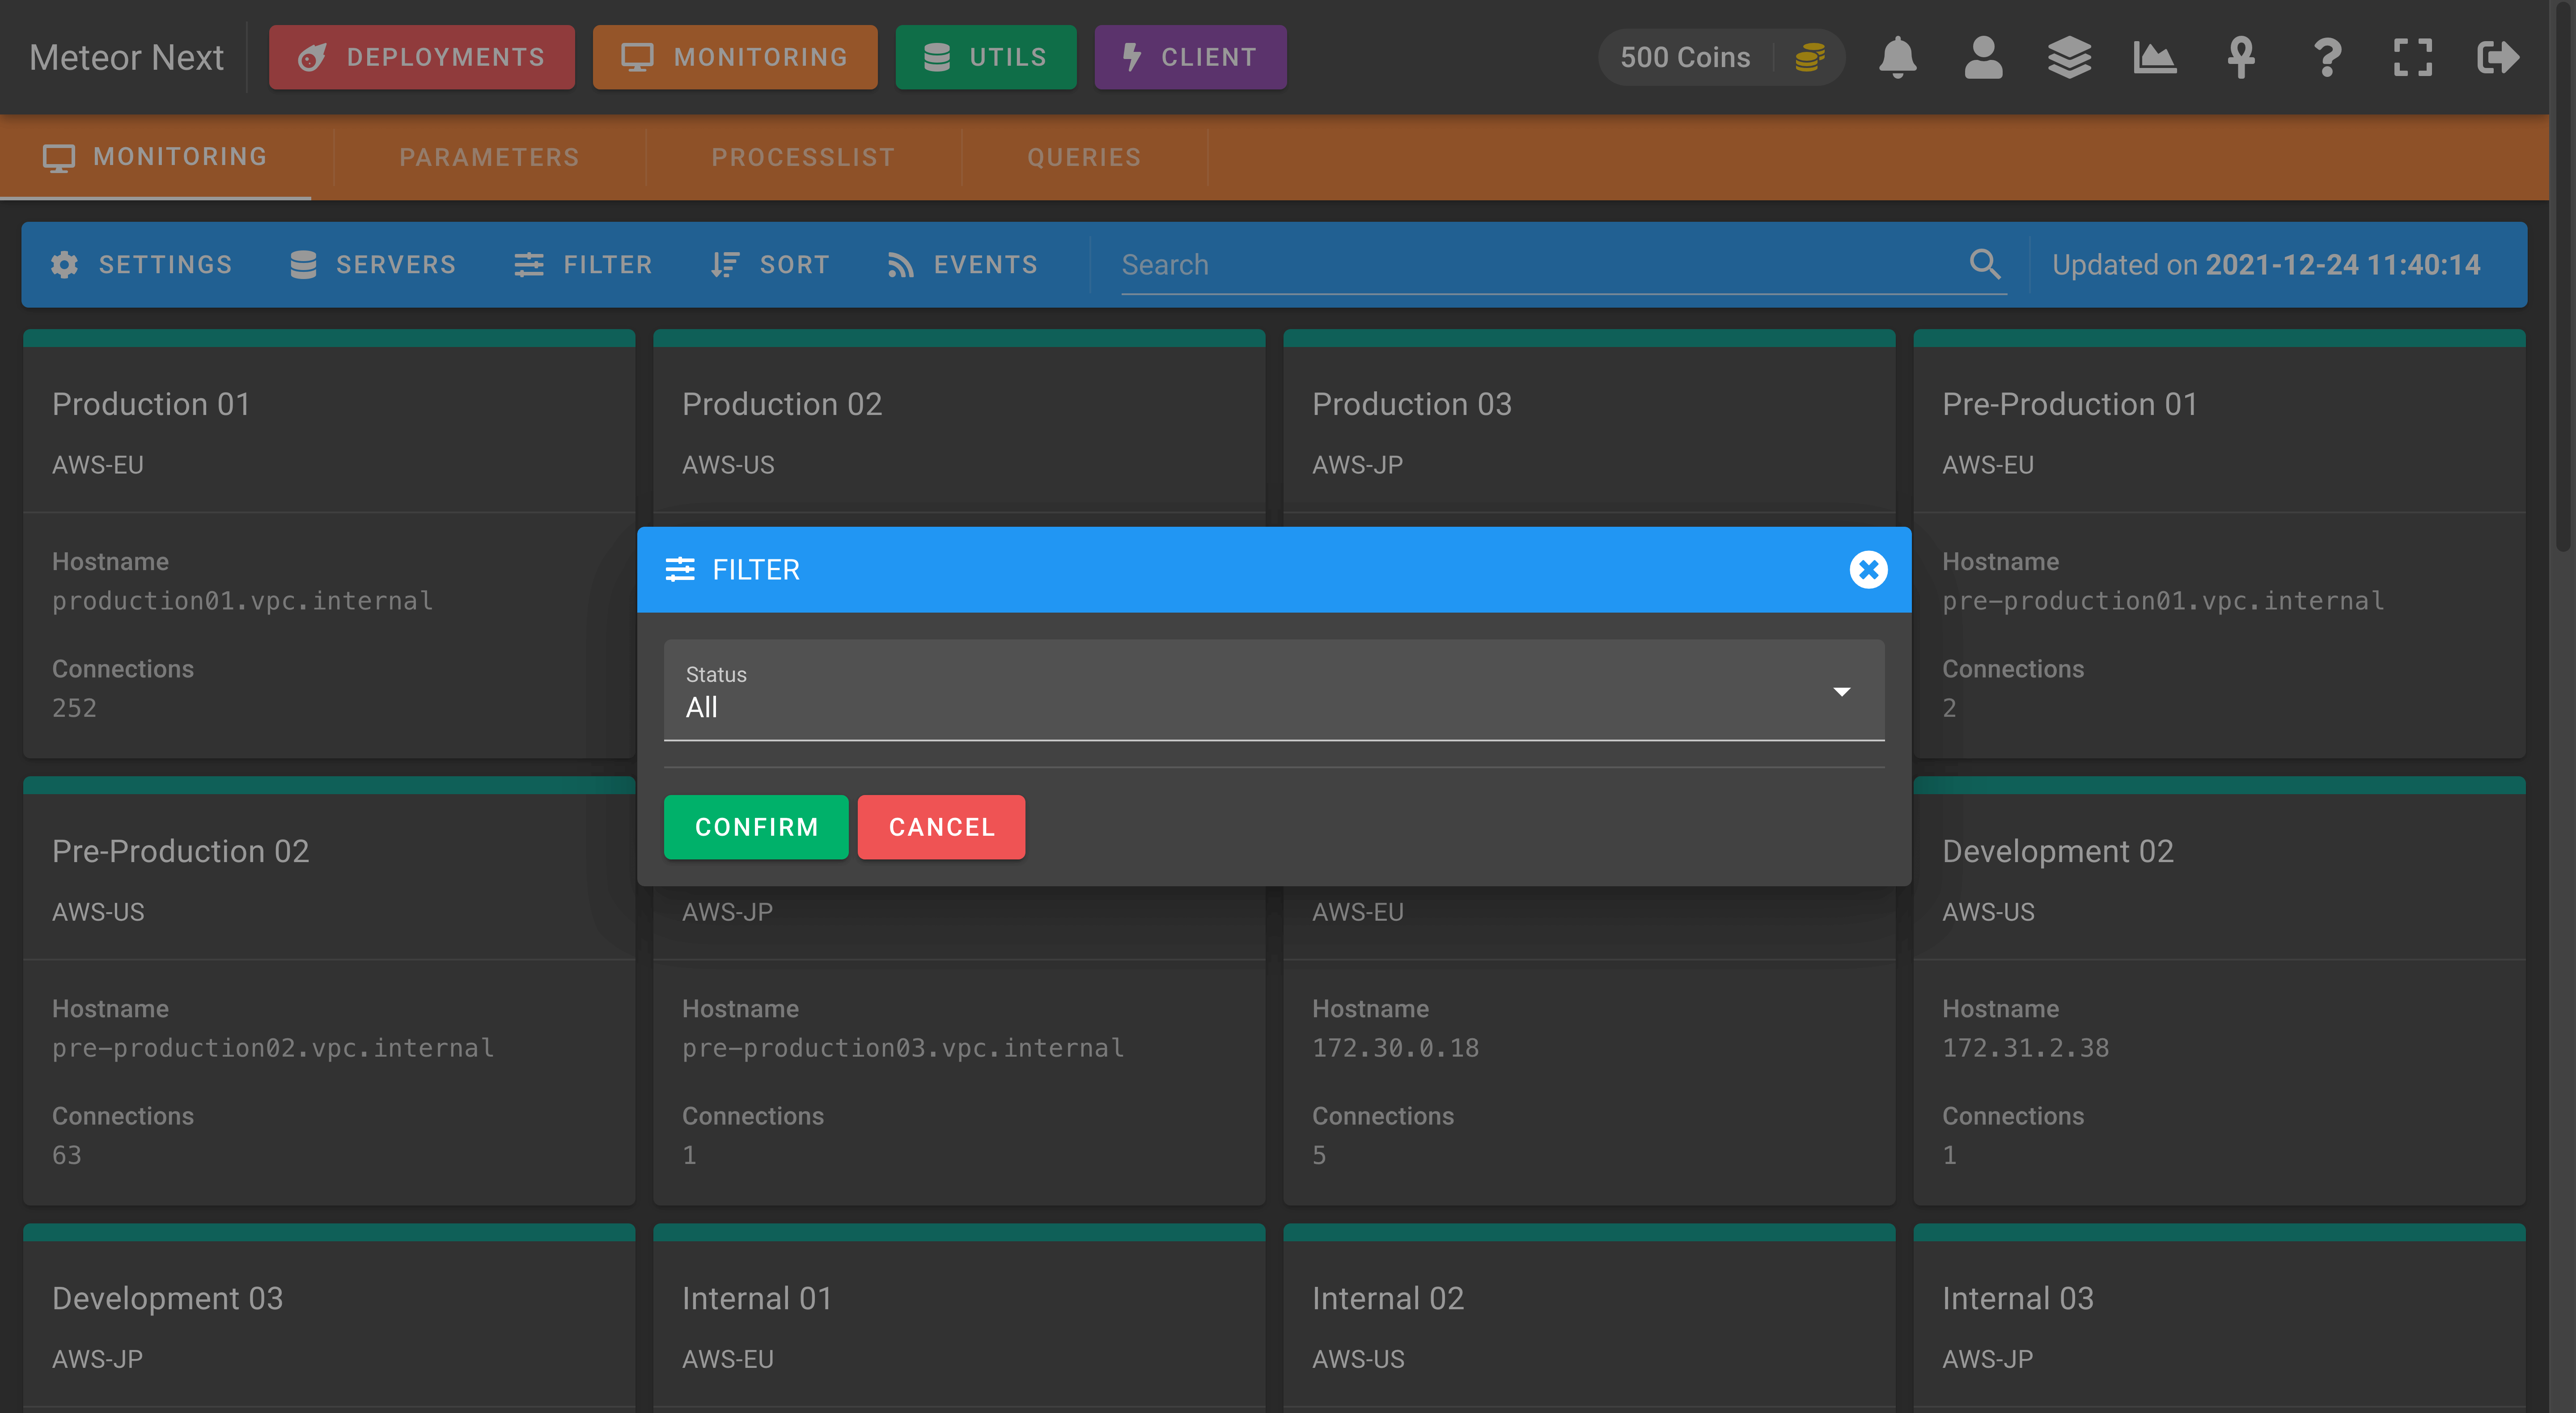
FILTER
This option is used to filter the servers in the list. The available options are:
- All: Show all monitored servers.
- Available: Show all monitored servers that are available.
- Unavailable: Show all monitored servers that are unavailable.
- Loading: Show all monitored servers that are being loaded (this status happens the first time we choose a server to be monitored).
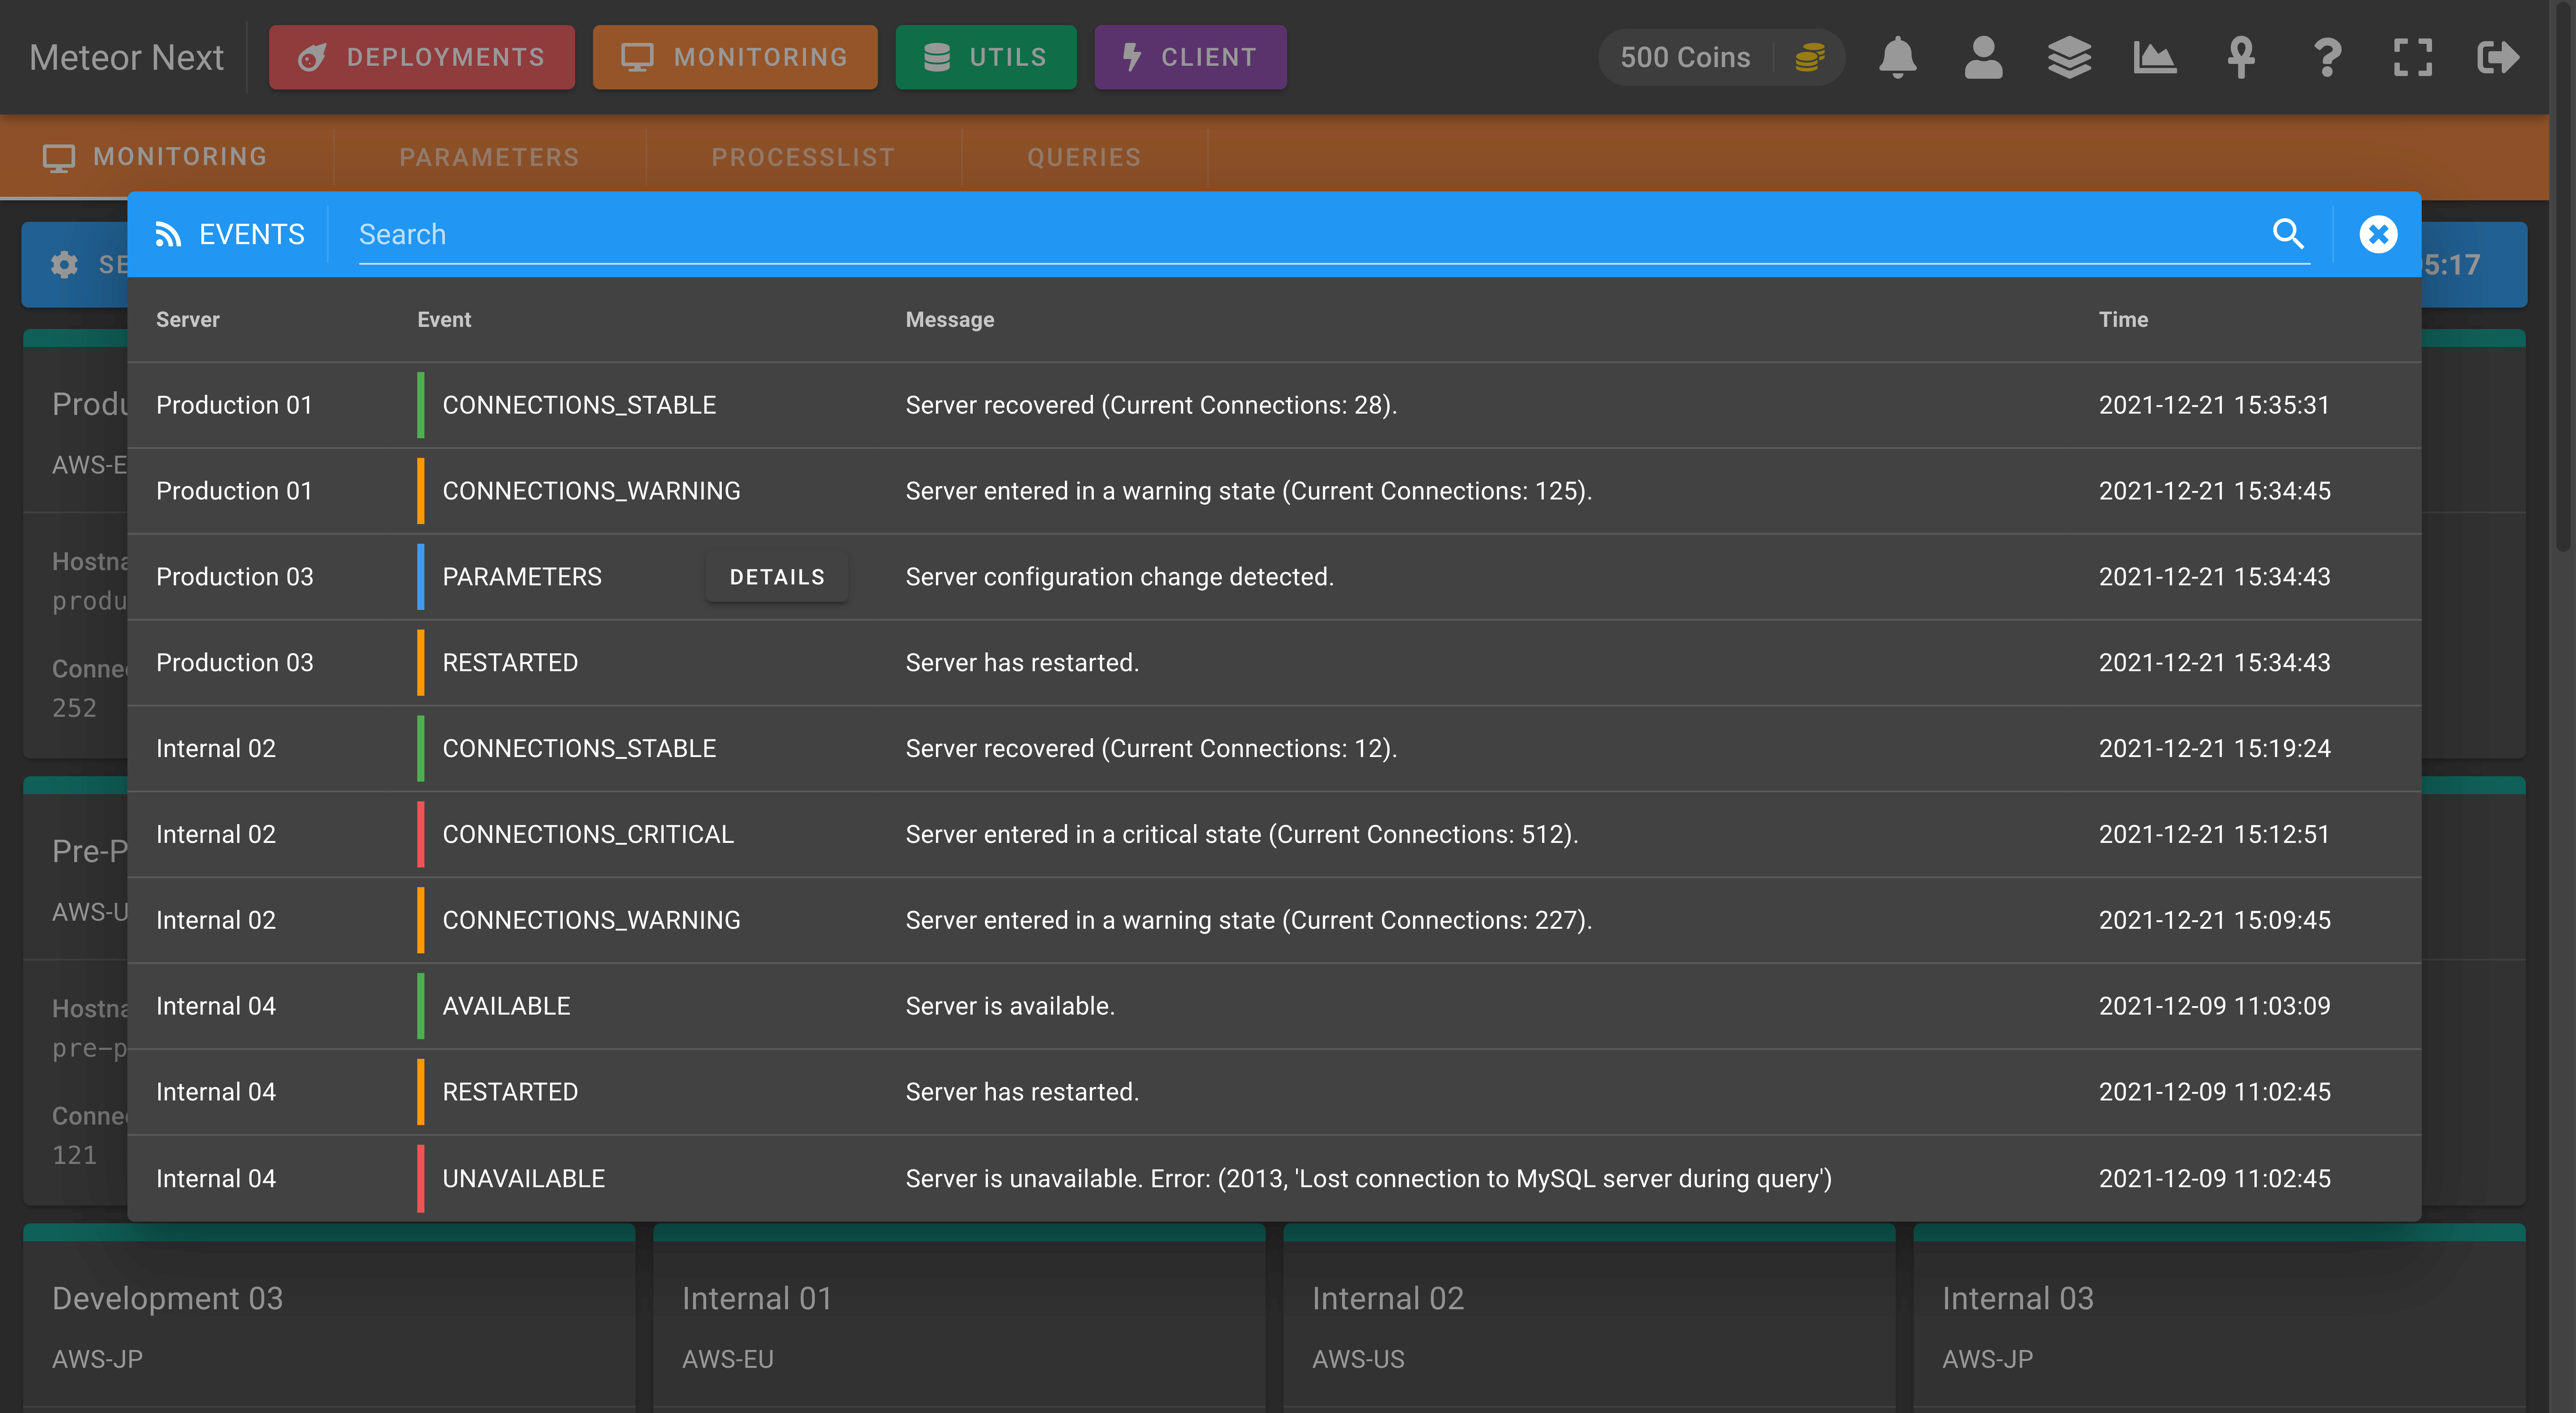
EVENTS
This option shows a screen with all the events happened in the last 15 days for all servers selected to be monitored.
Parameters
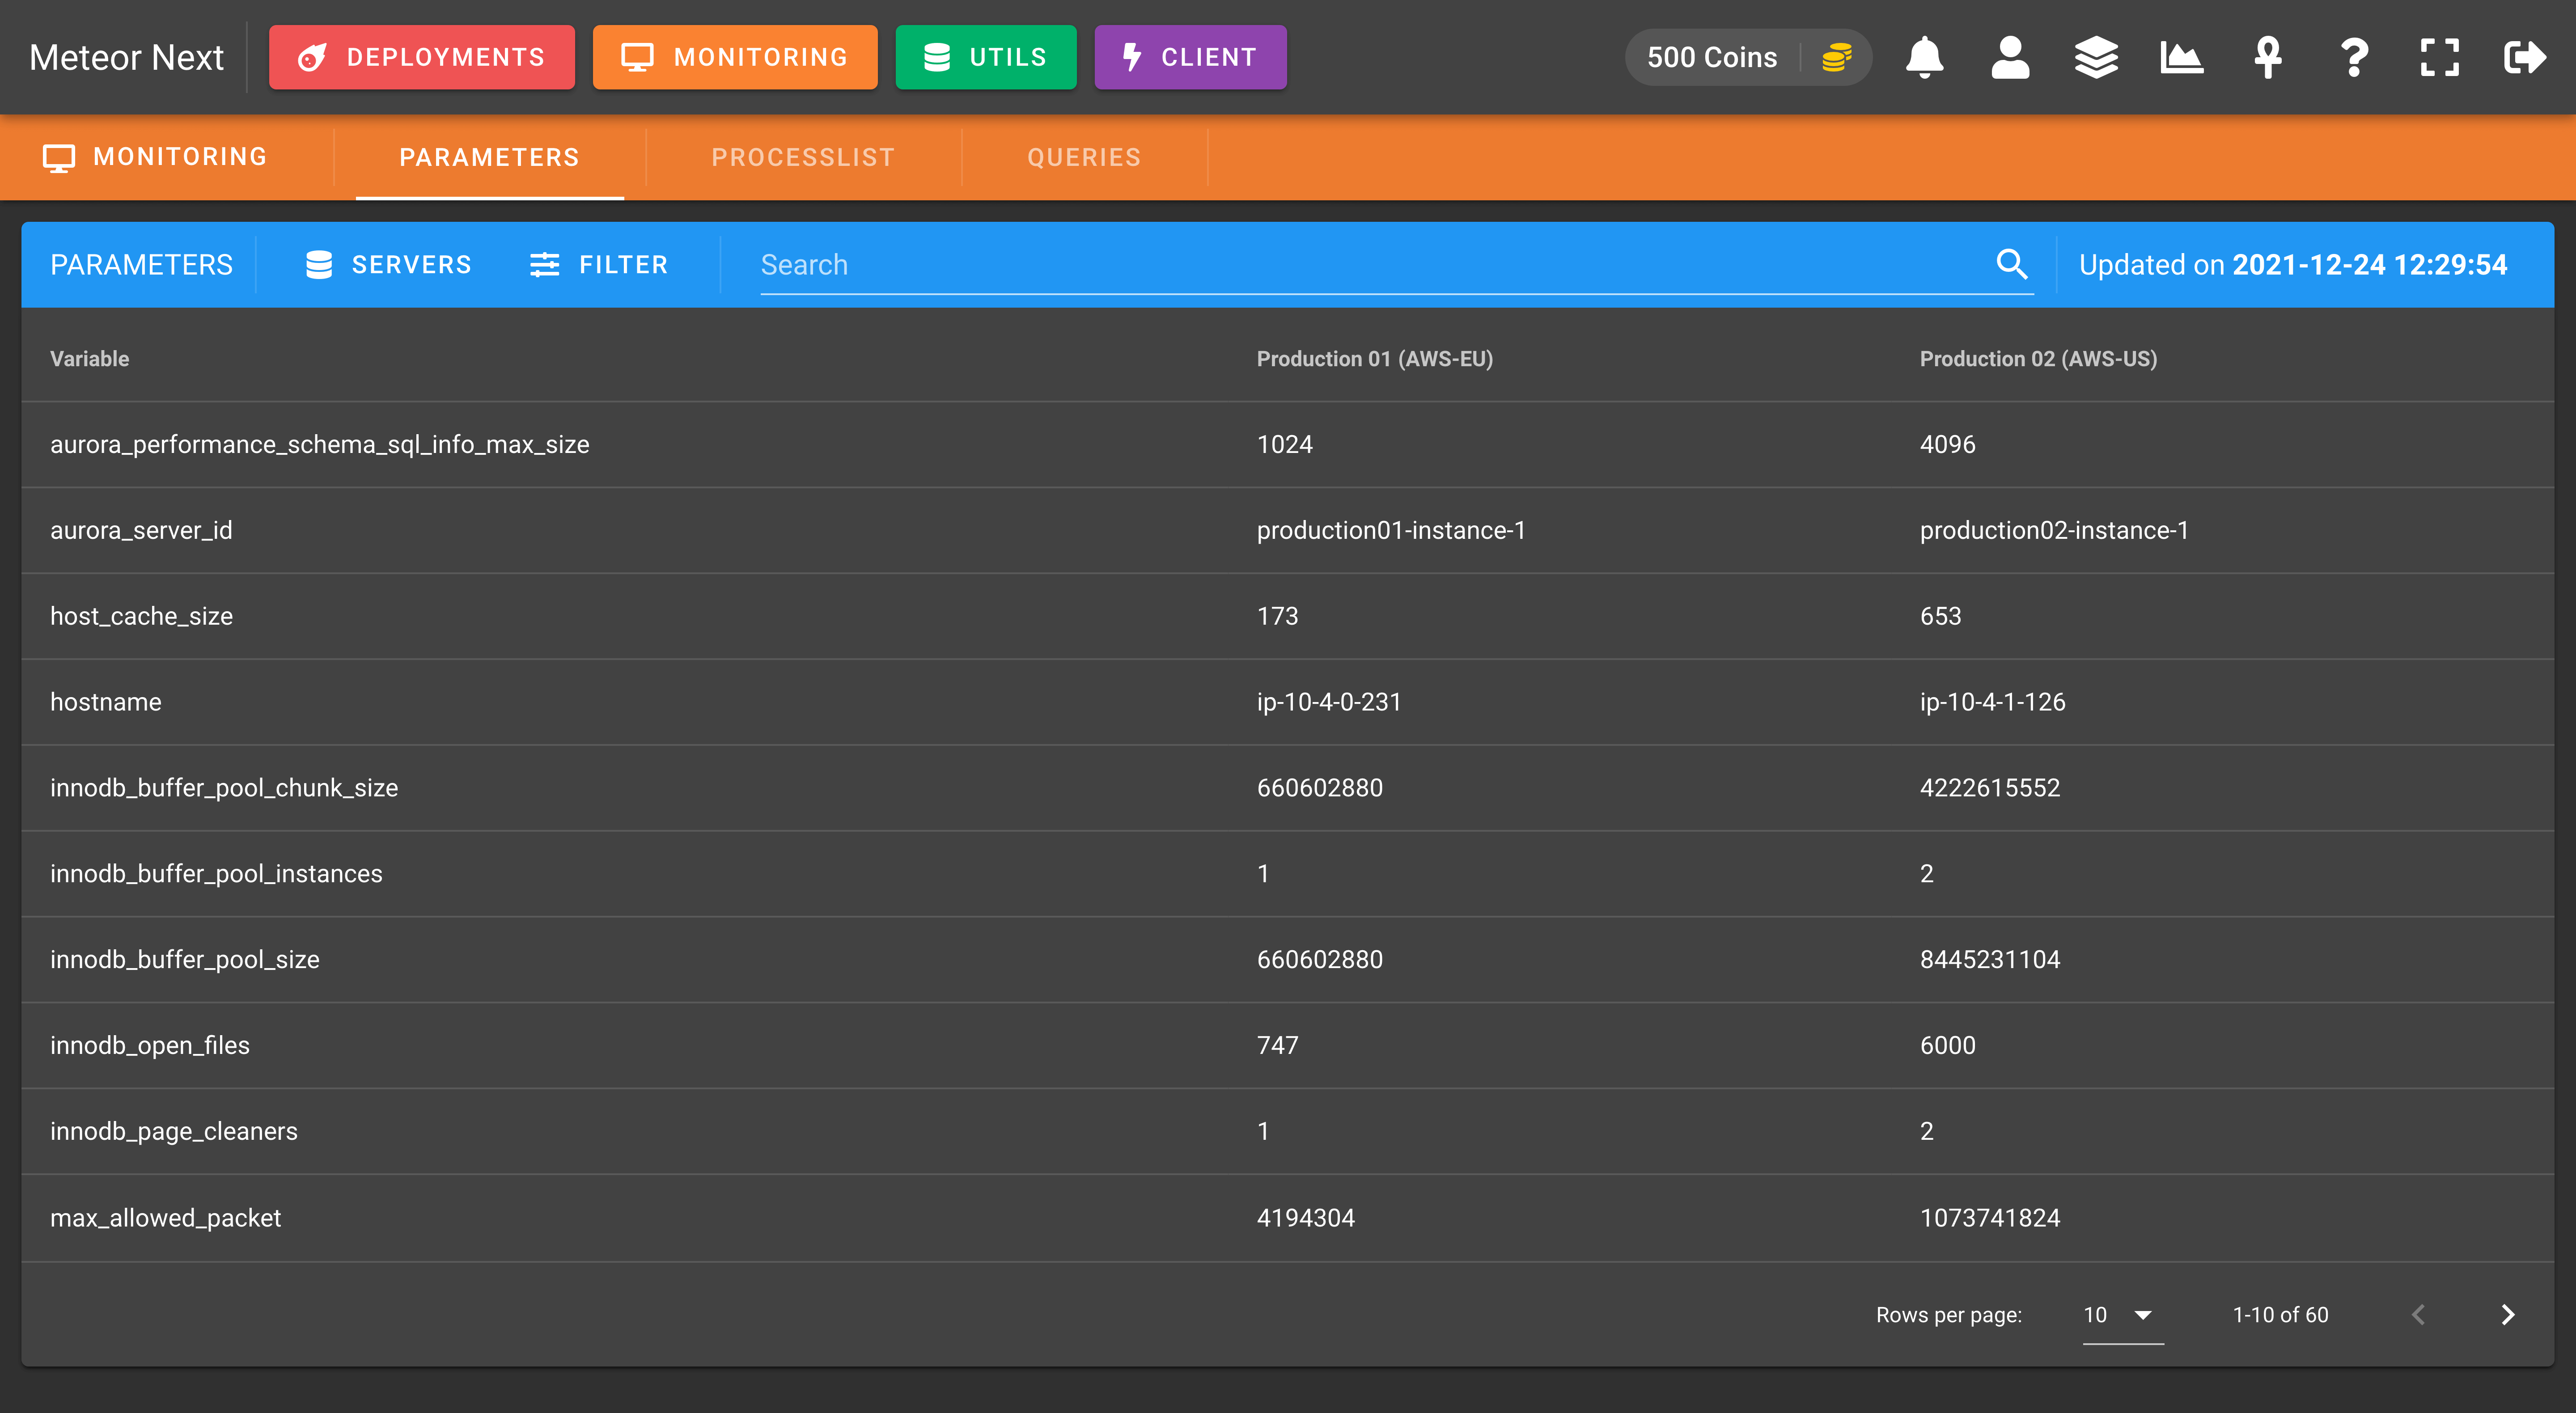
This section is used to get the values of MySQL system variables and to compare them with other servers.

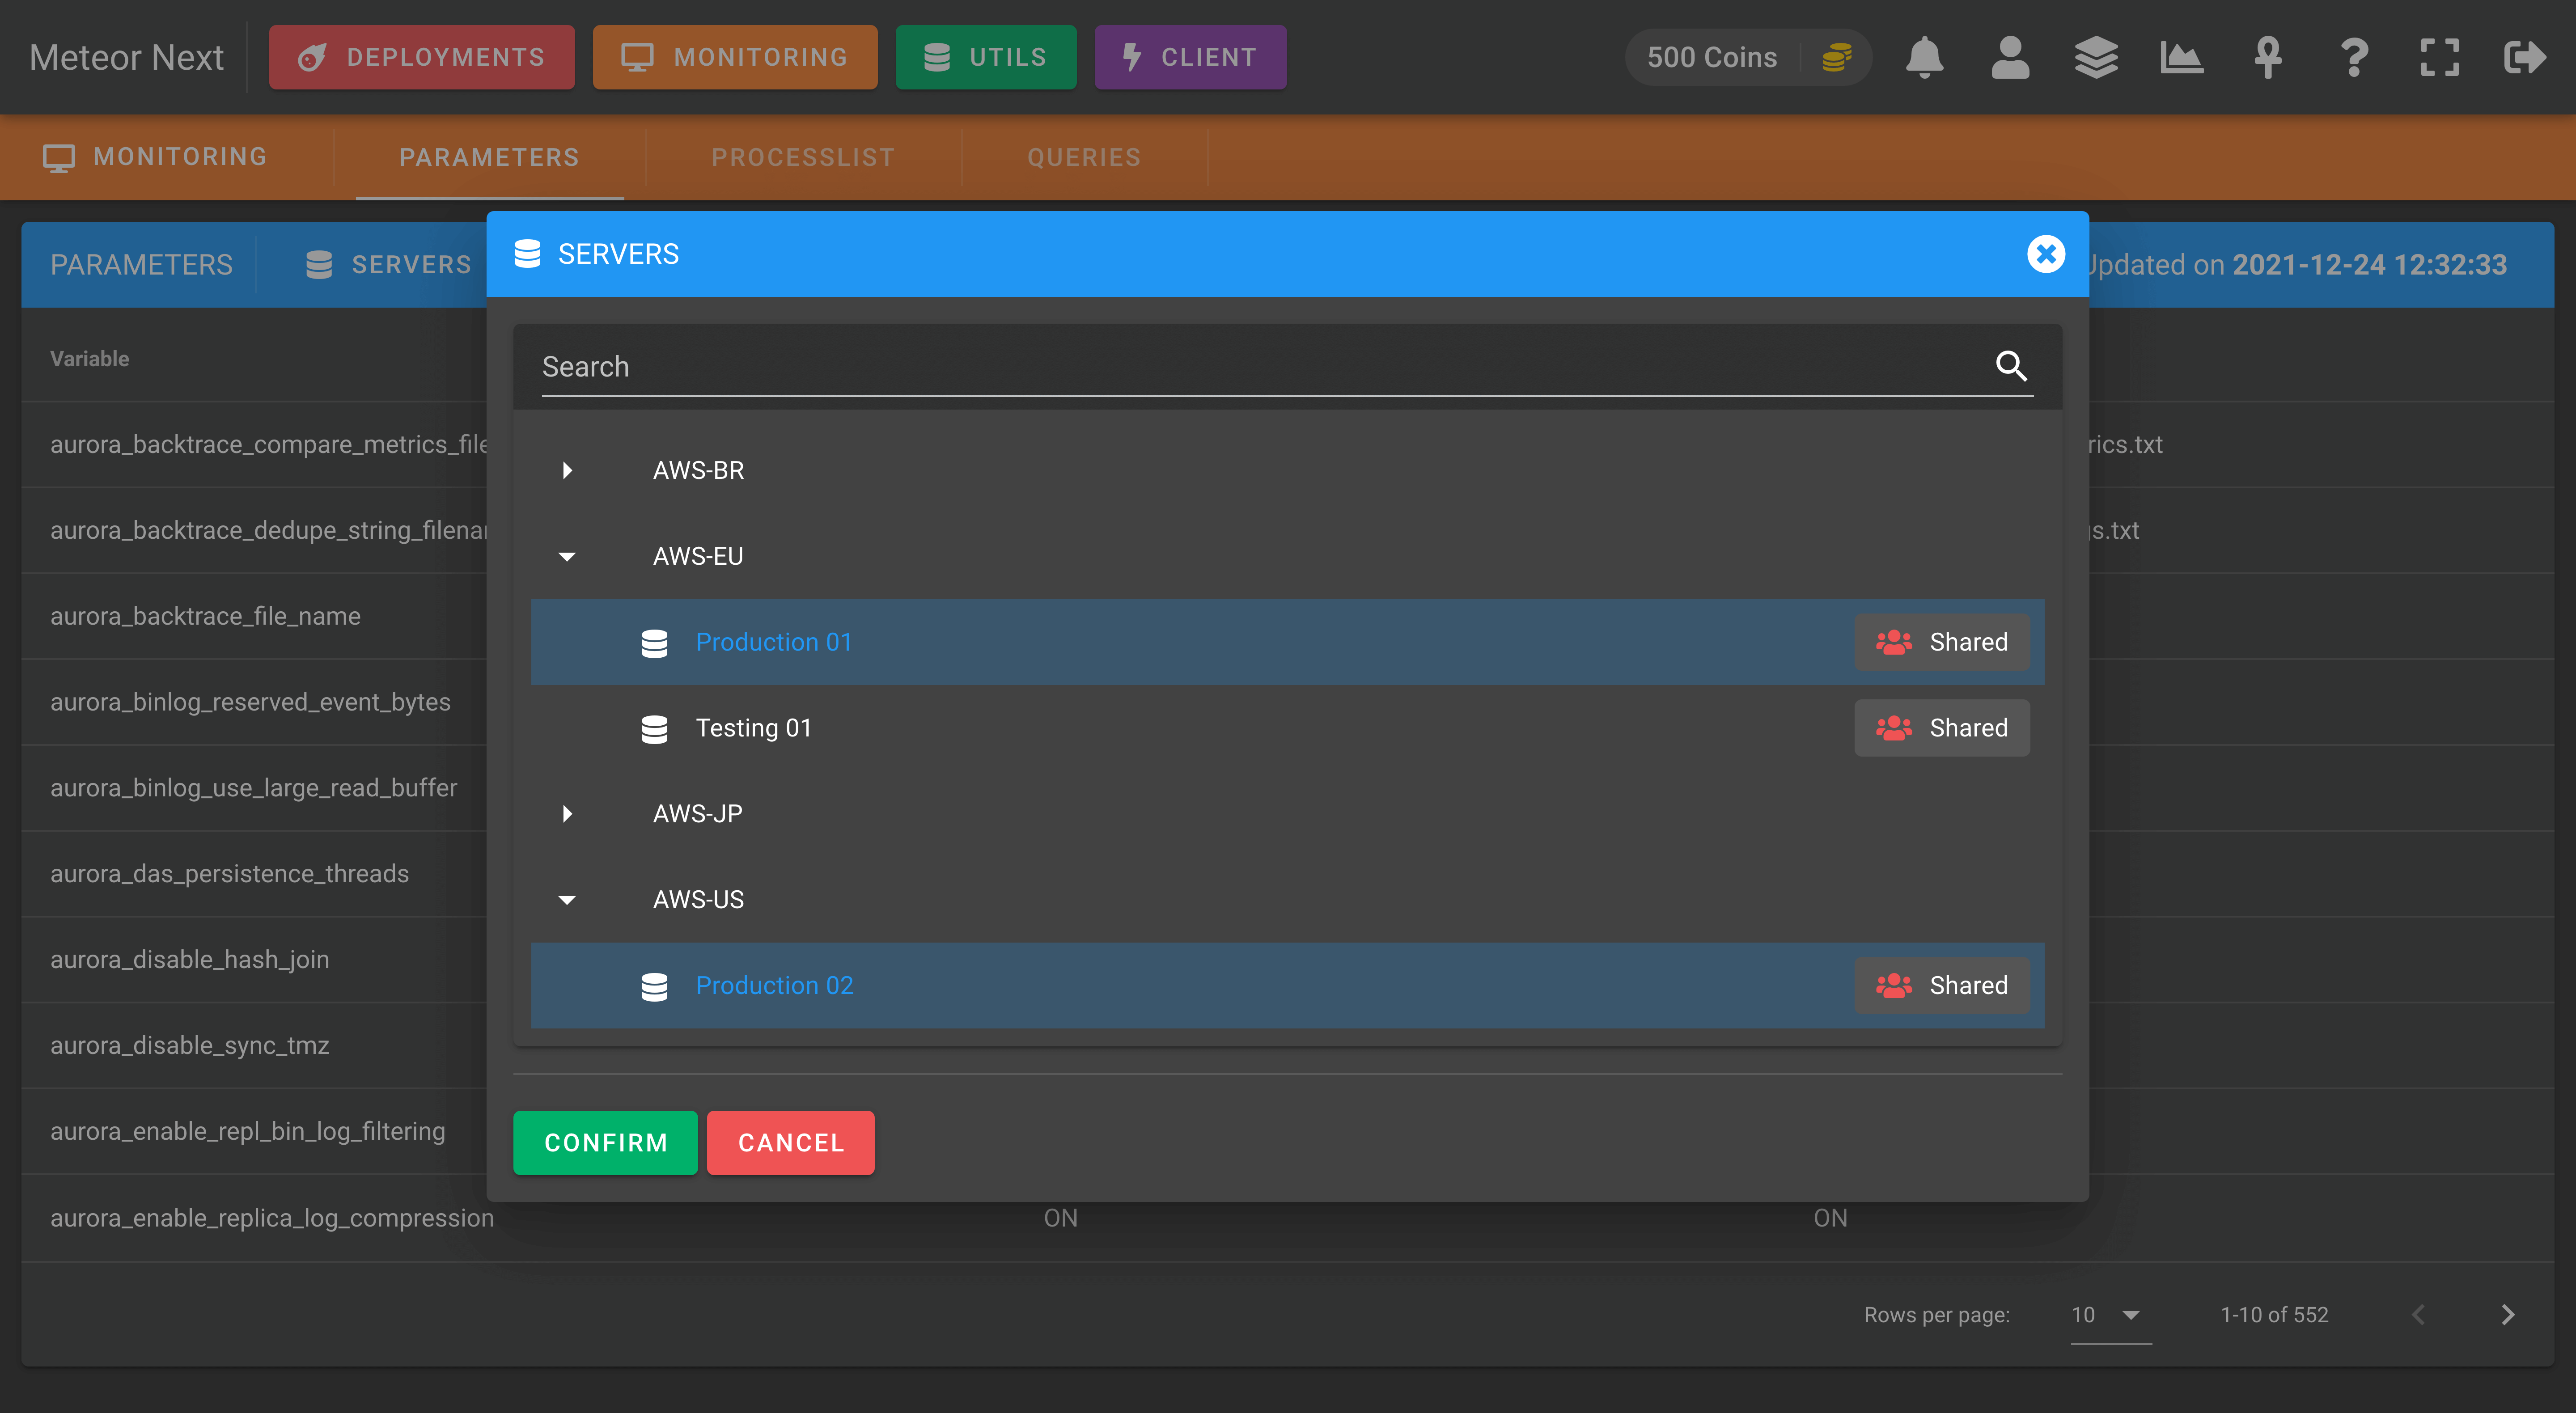
SERVERS
Here, we can select which servers of our inventory we want to monitor their parameters.
FILTER
This option is used to filter the parameters in the list. The available options are:
- All: Show all parameters.
- Matching: Show all parameters matching with all selected servers.
- Not matching: Show all parameters not matching with all selected servers.
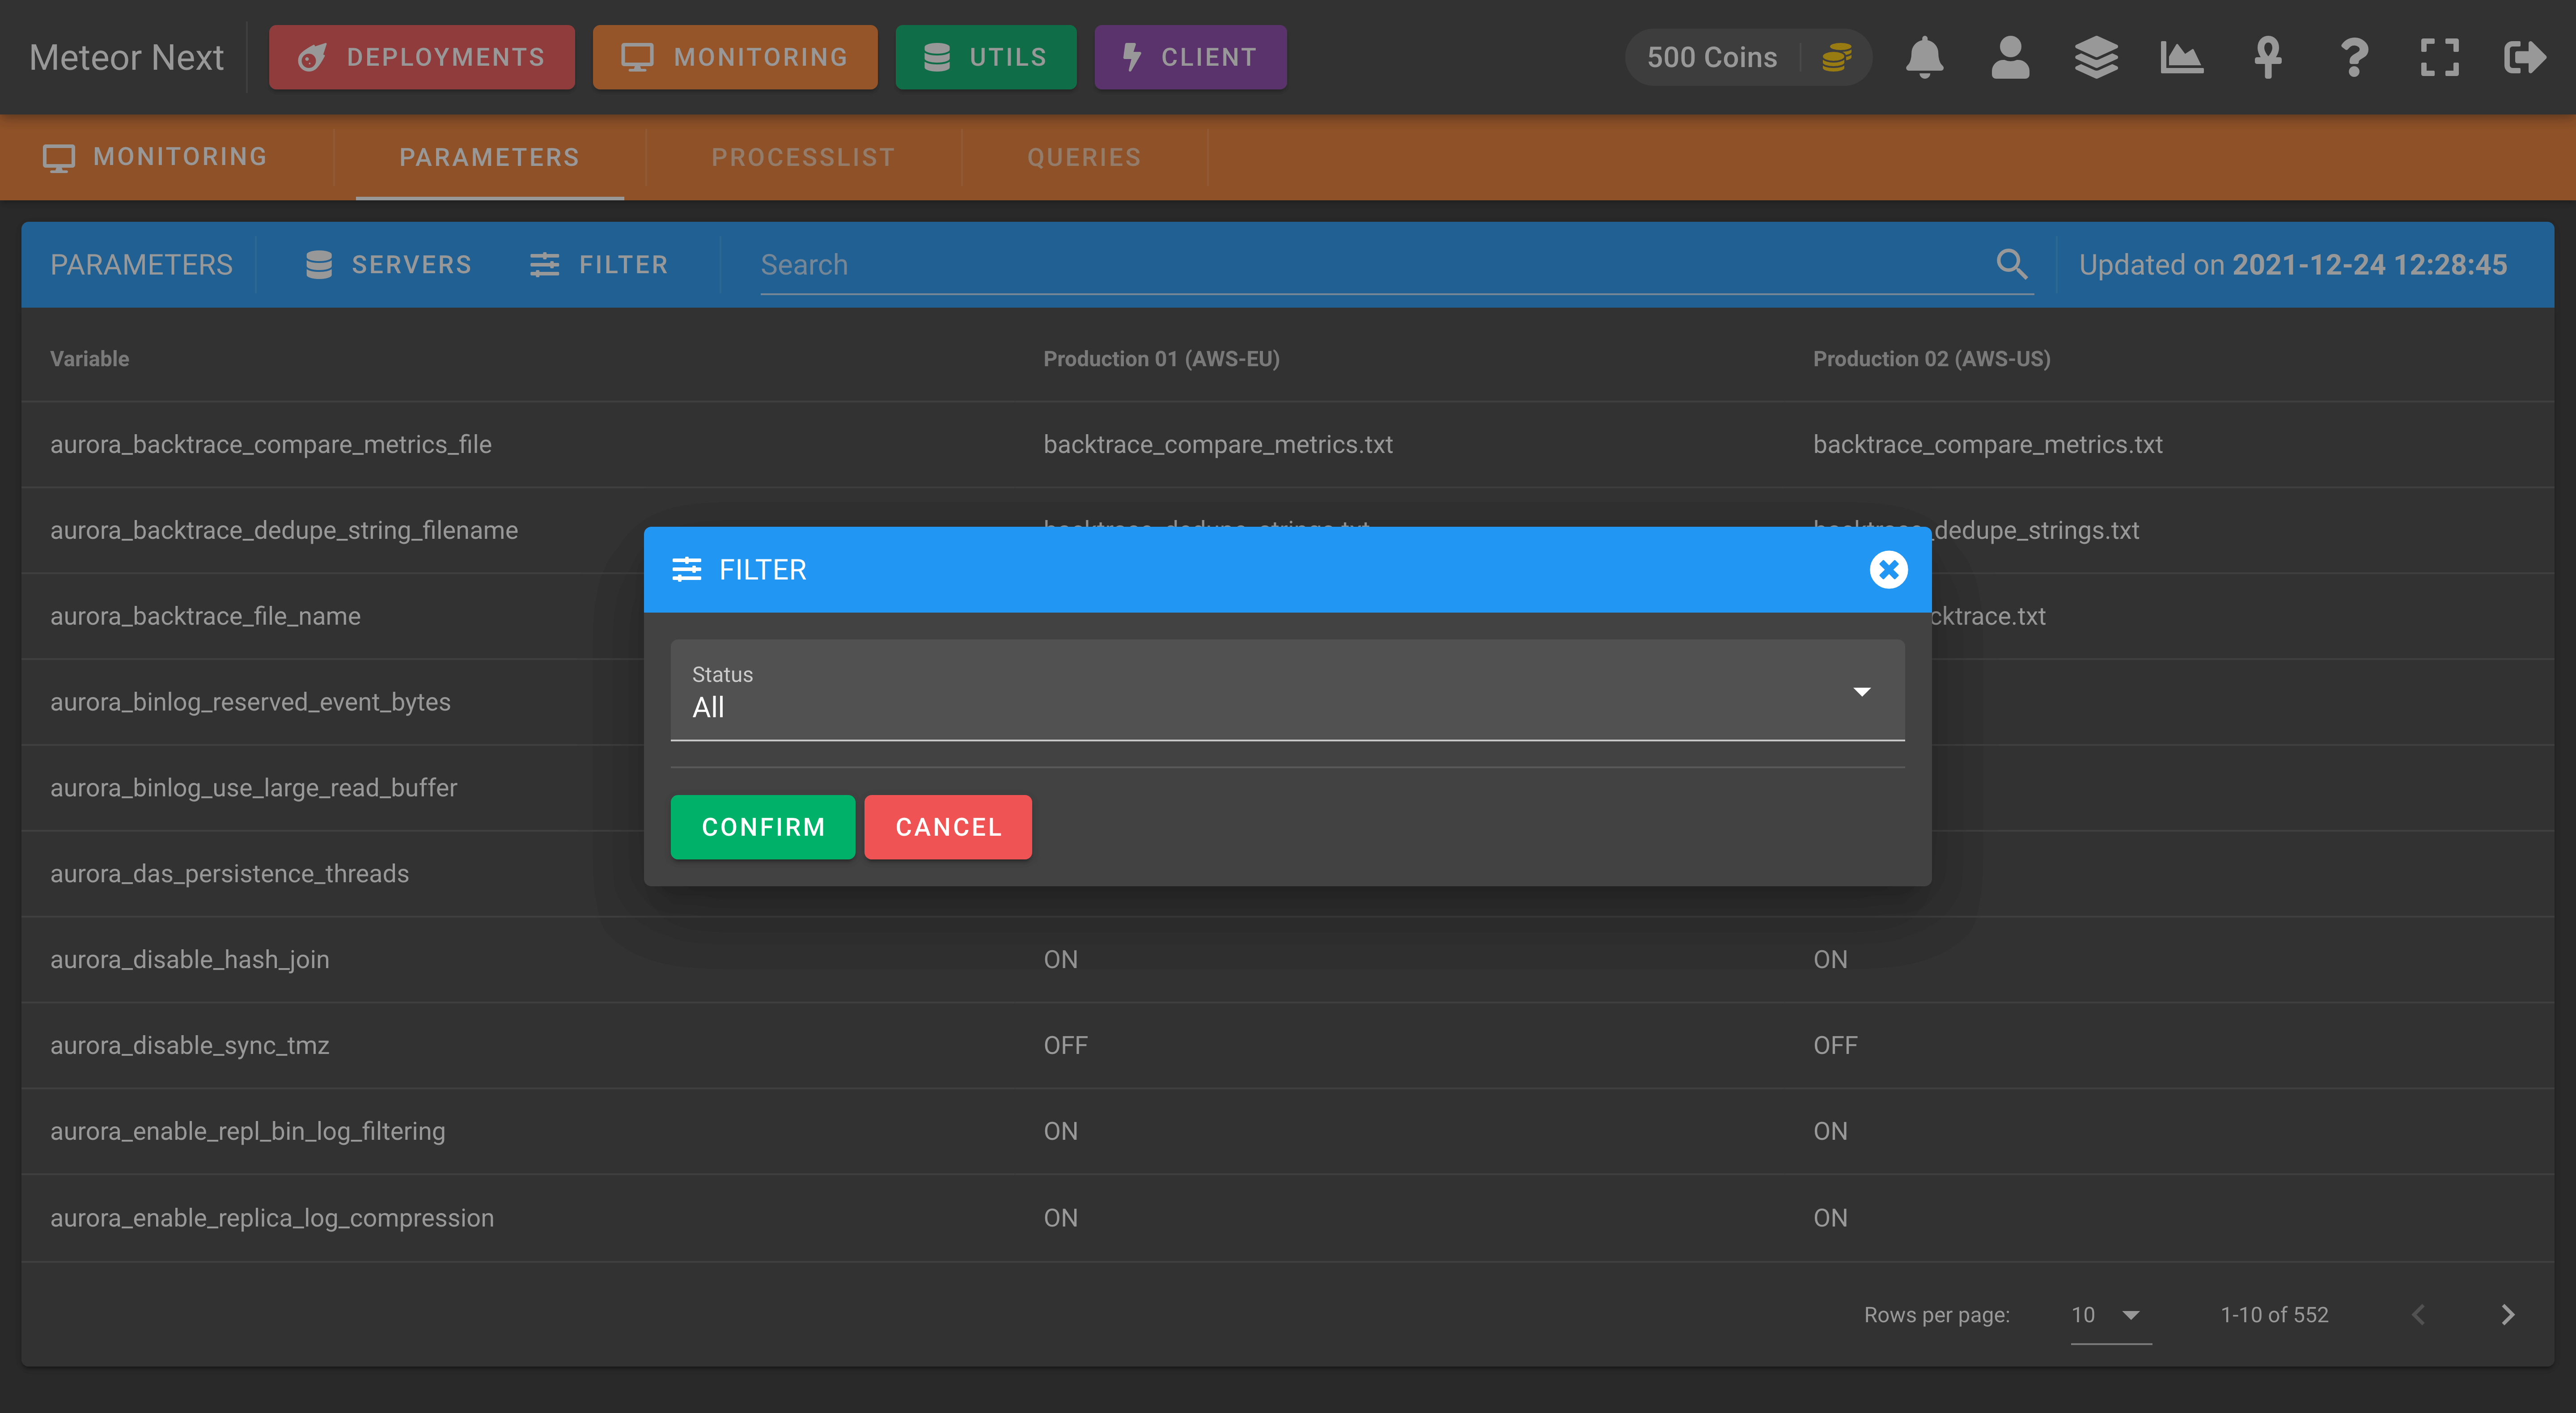
In the following screenshot we can see an example of filtering with the Not matching option.
Processlist
This section is used to monitor in real-time all the queries that are being executed in the selected servers.

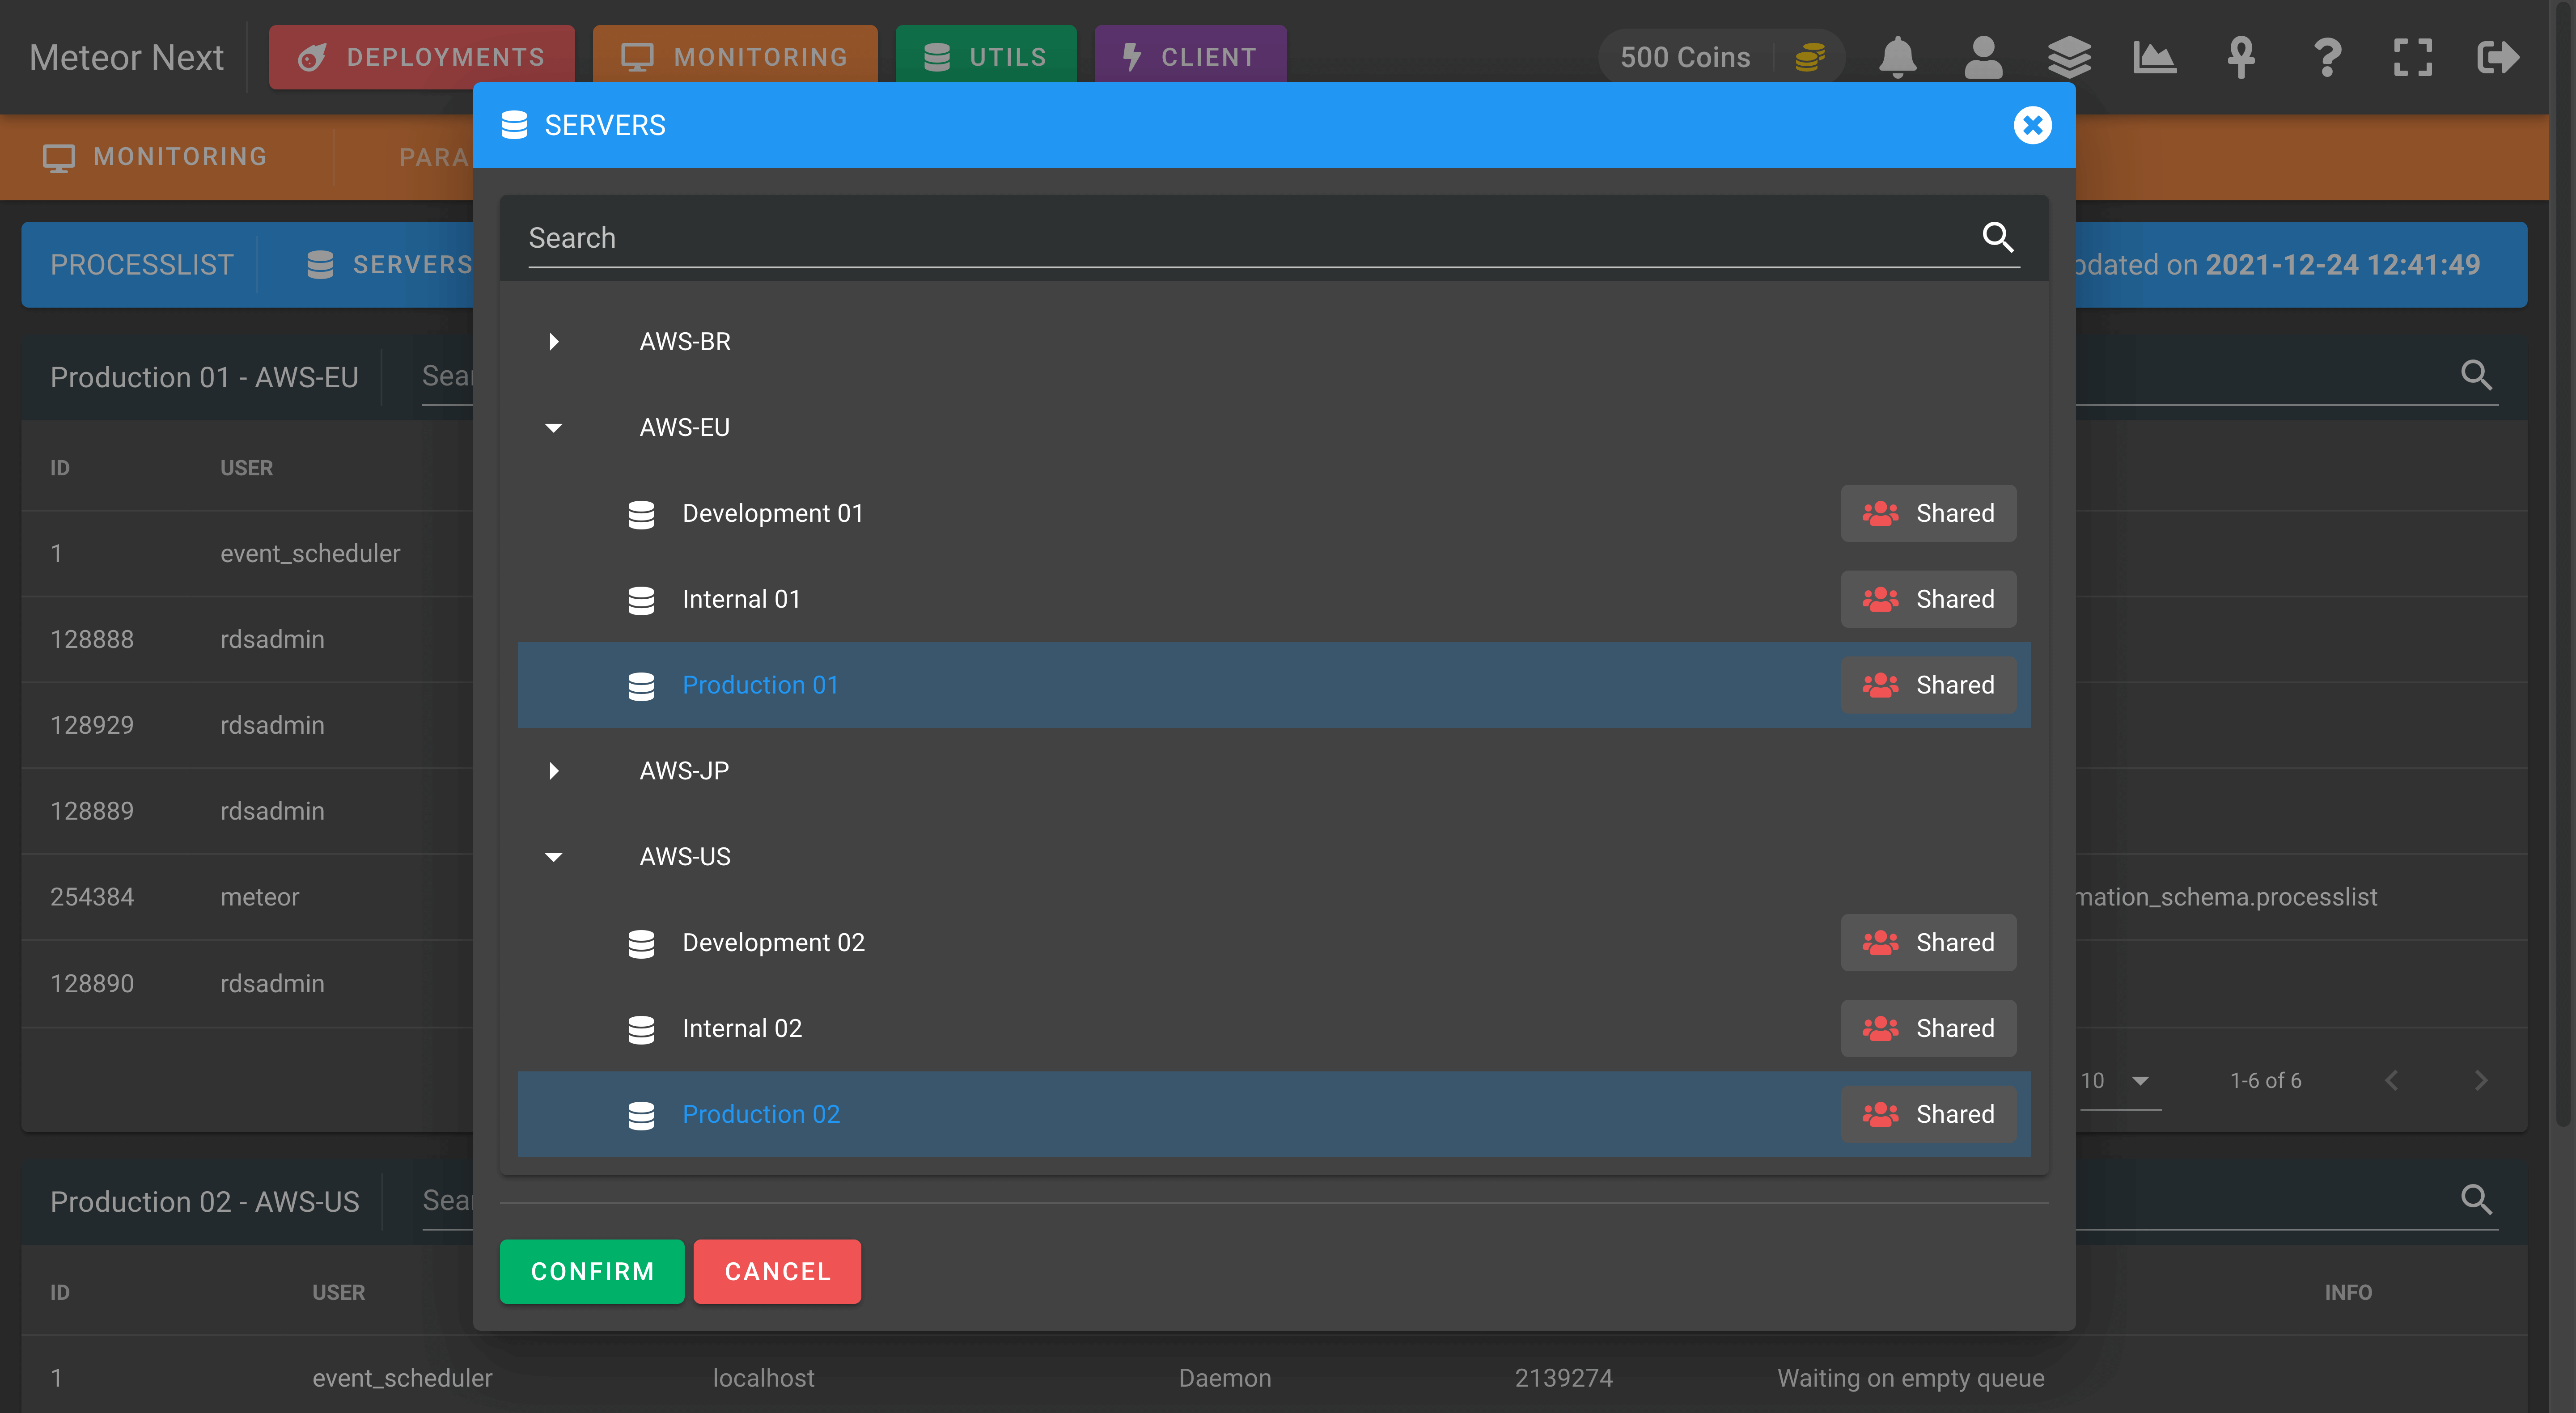
SERVERS
Here, we can select which servers of our inventory we want to monitor their queries.
FILTER
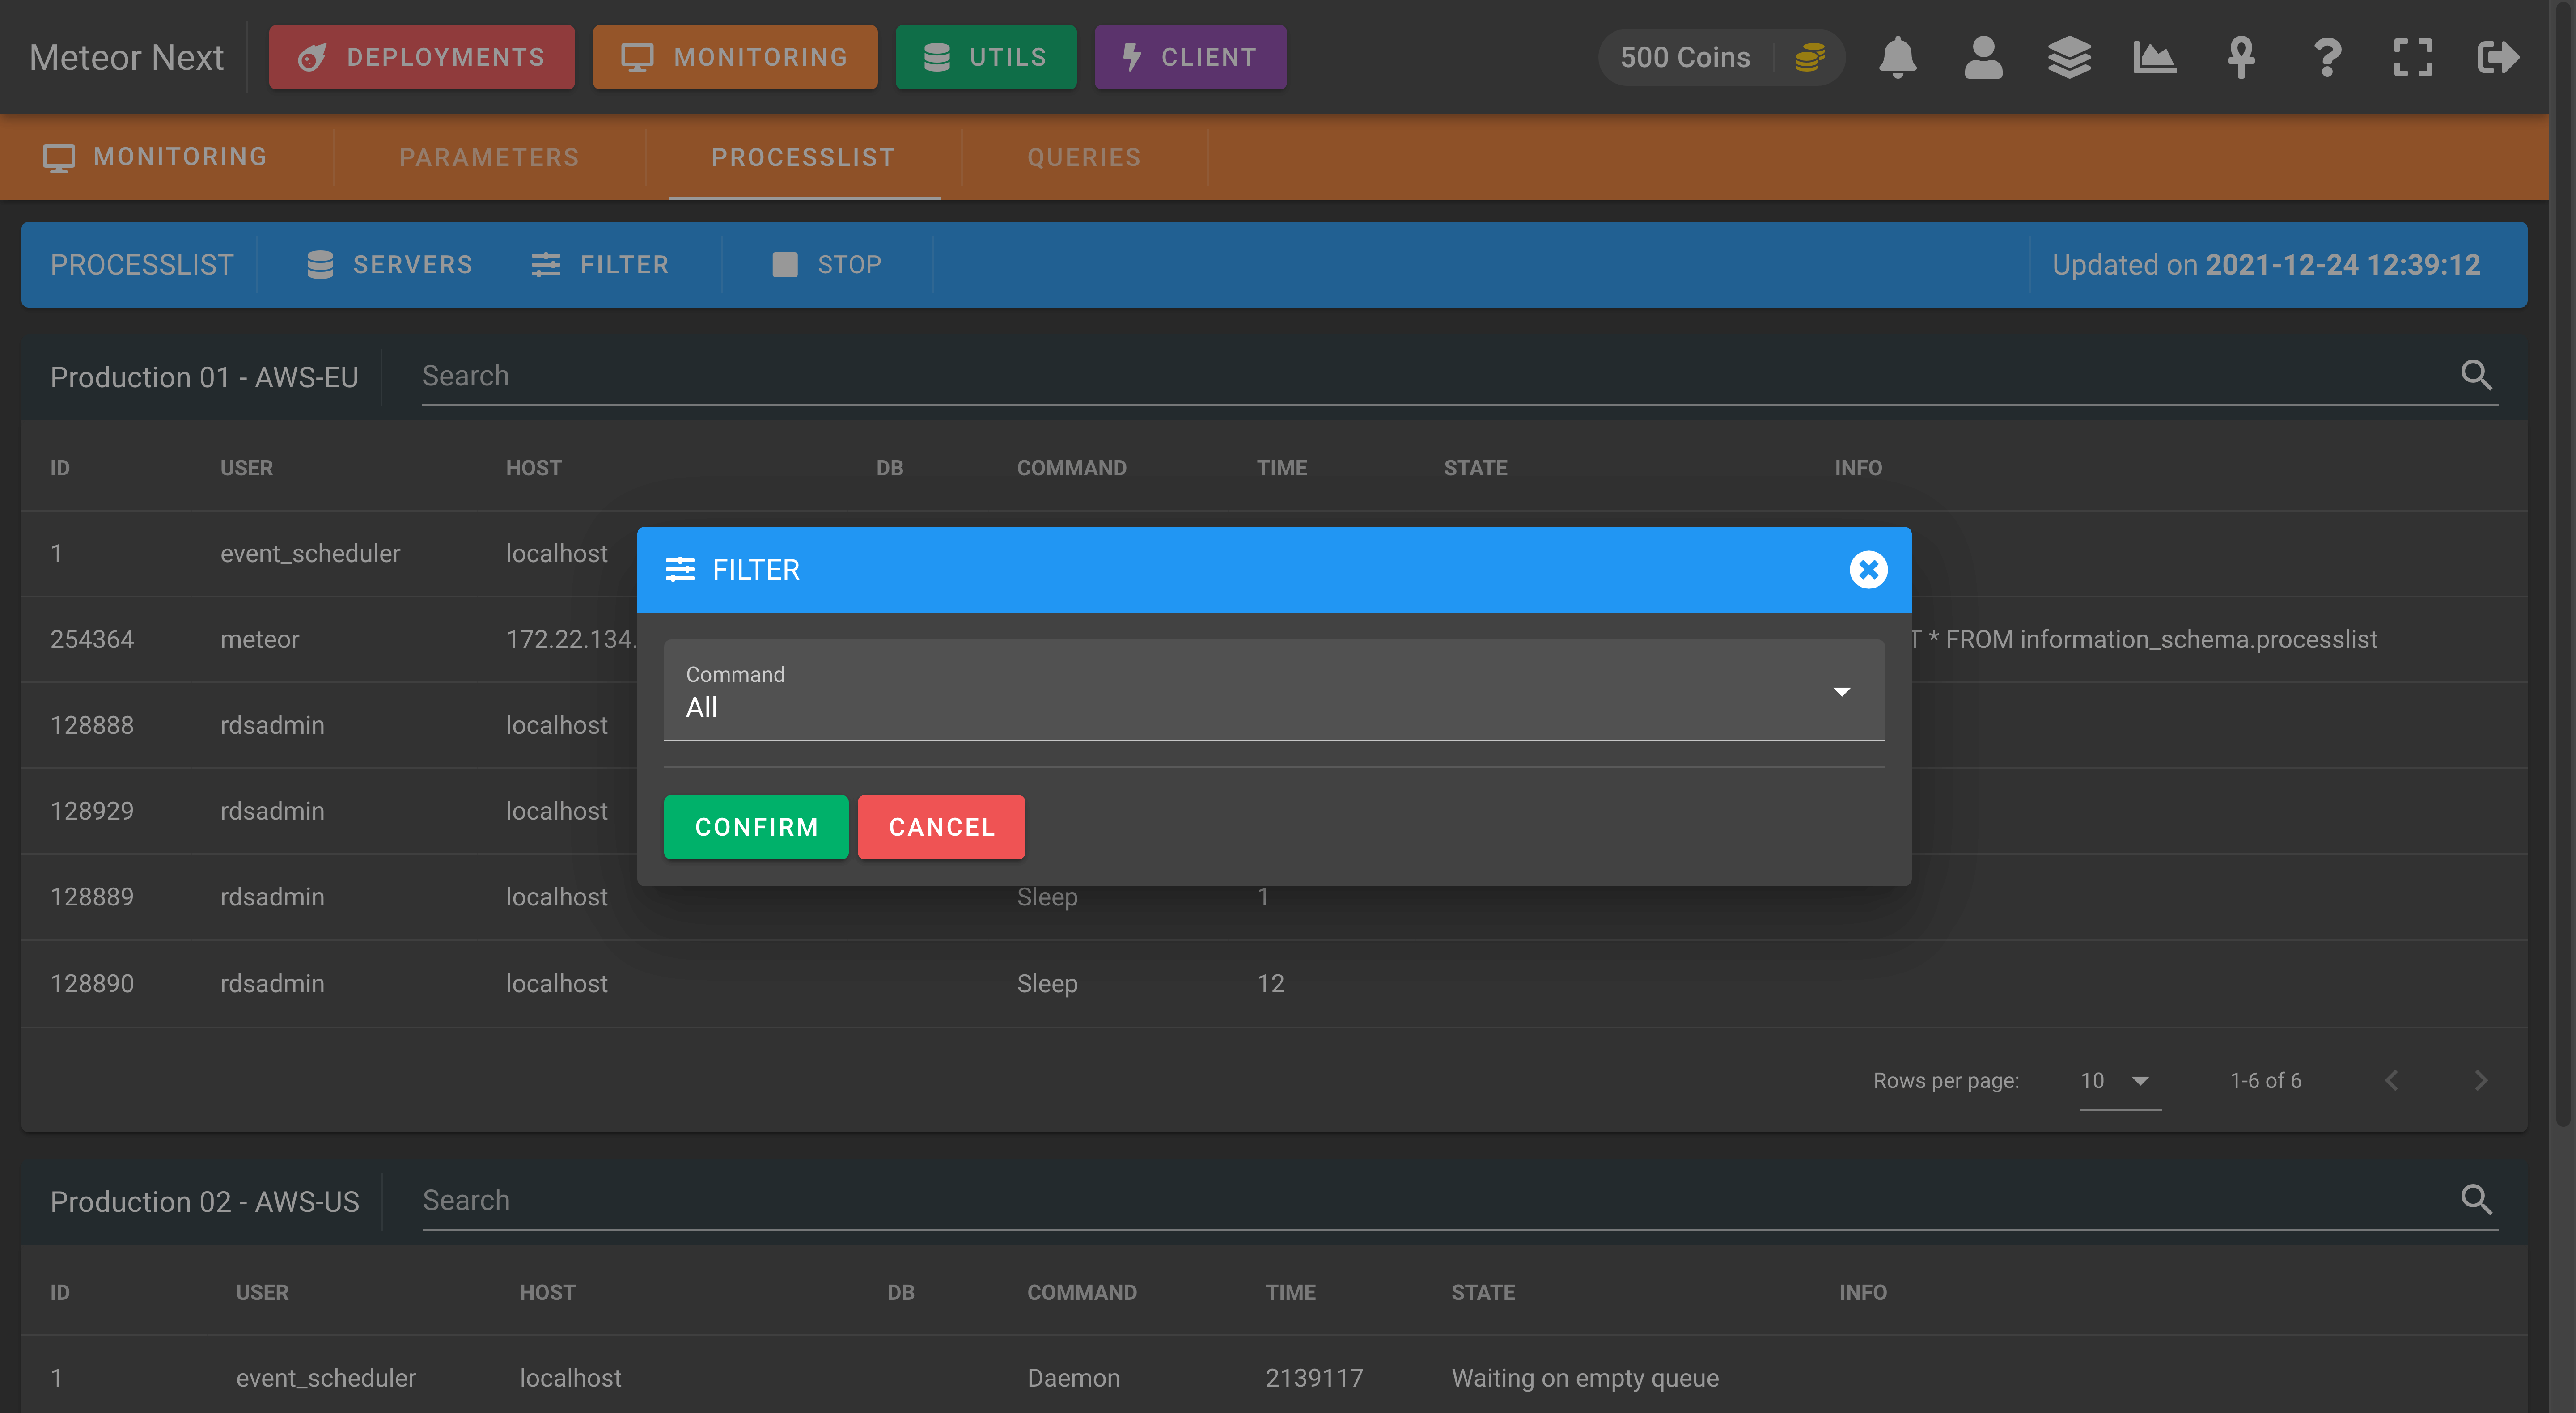
This option is used to filter the queries in the list. The available options are:
- All: Show all queries and sessions.
- Query: Show queries being executed.
- Sleep: Show idle sessions.
Queries
This section is used to track slow queries to be later analysed.

SETTINGS
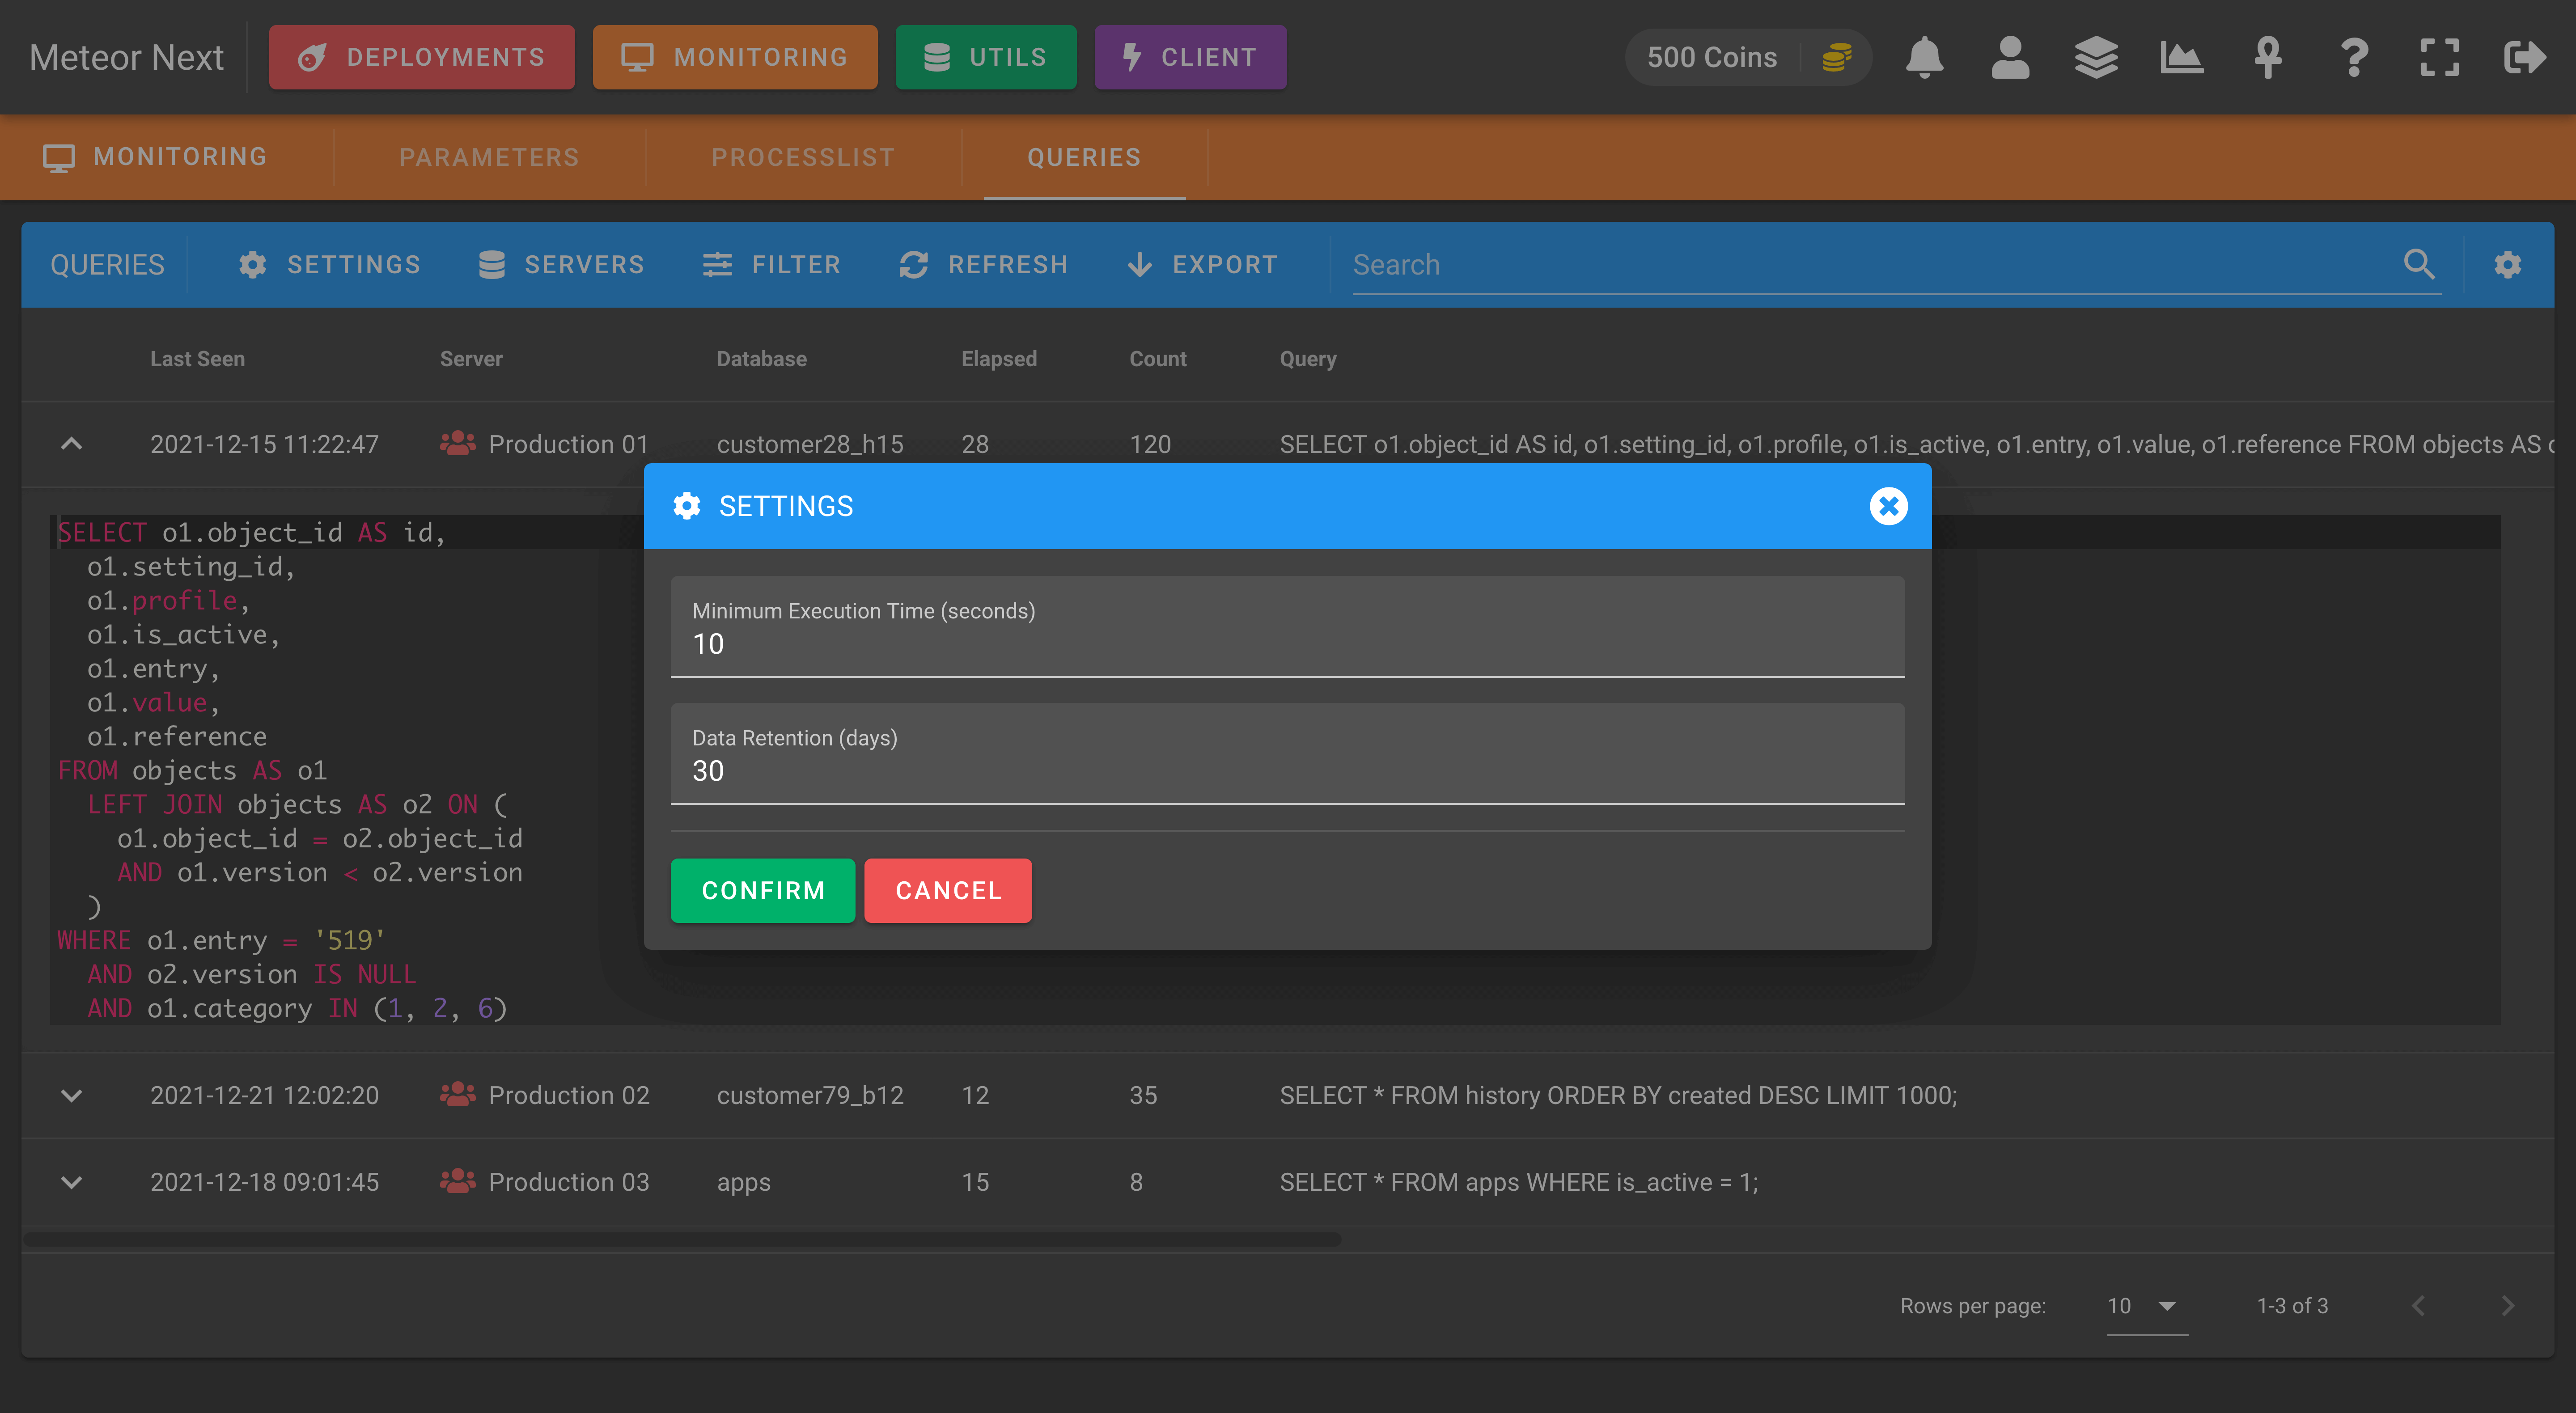
There are some settings that can be defined:
- Minimum Execution Time (seconds): Meteor will track all queries that their execution time is equal or greater than this value.
- Data Retention (days): The maximum number of days to retain the data. All queries that have been executed X days ago, will be deleted from the list.
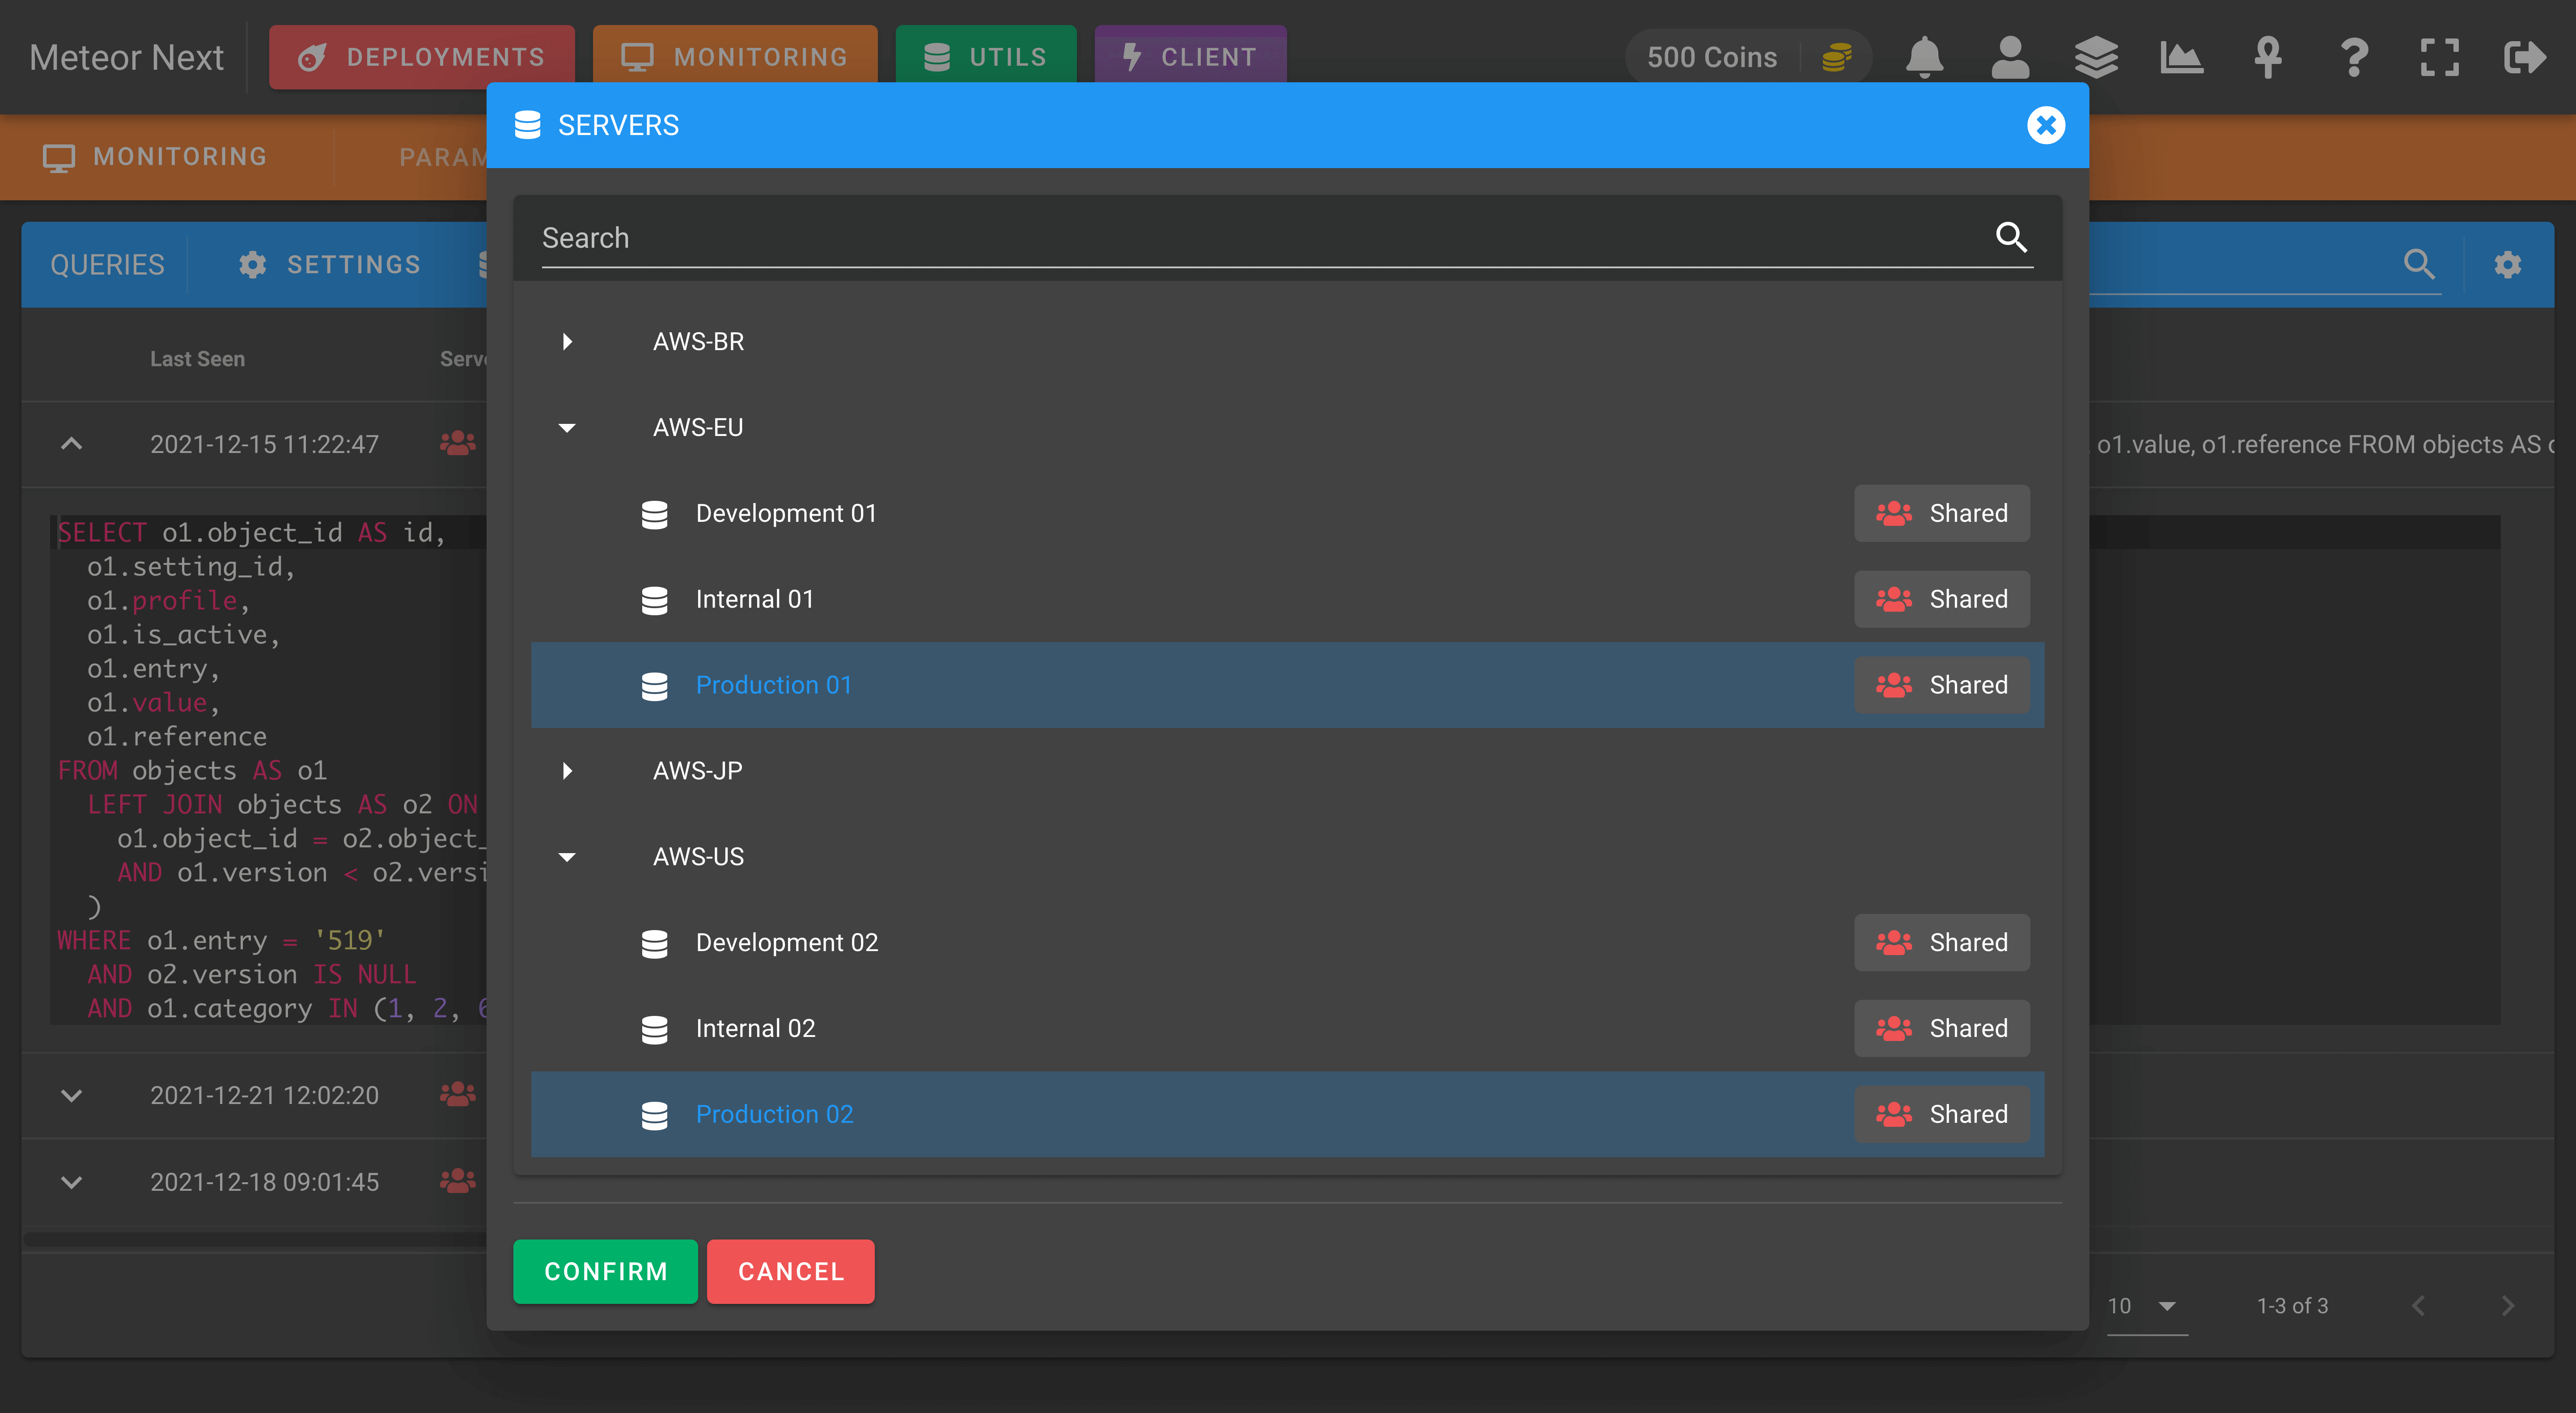
SERVERS
Here we can select which servers of our inventory we want to track their slow queries.
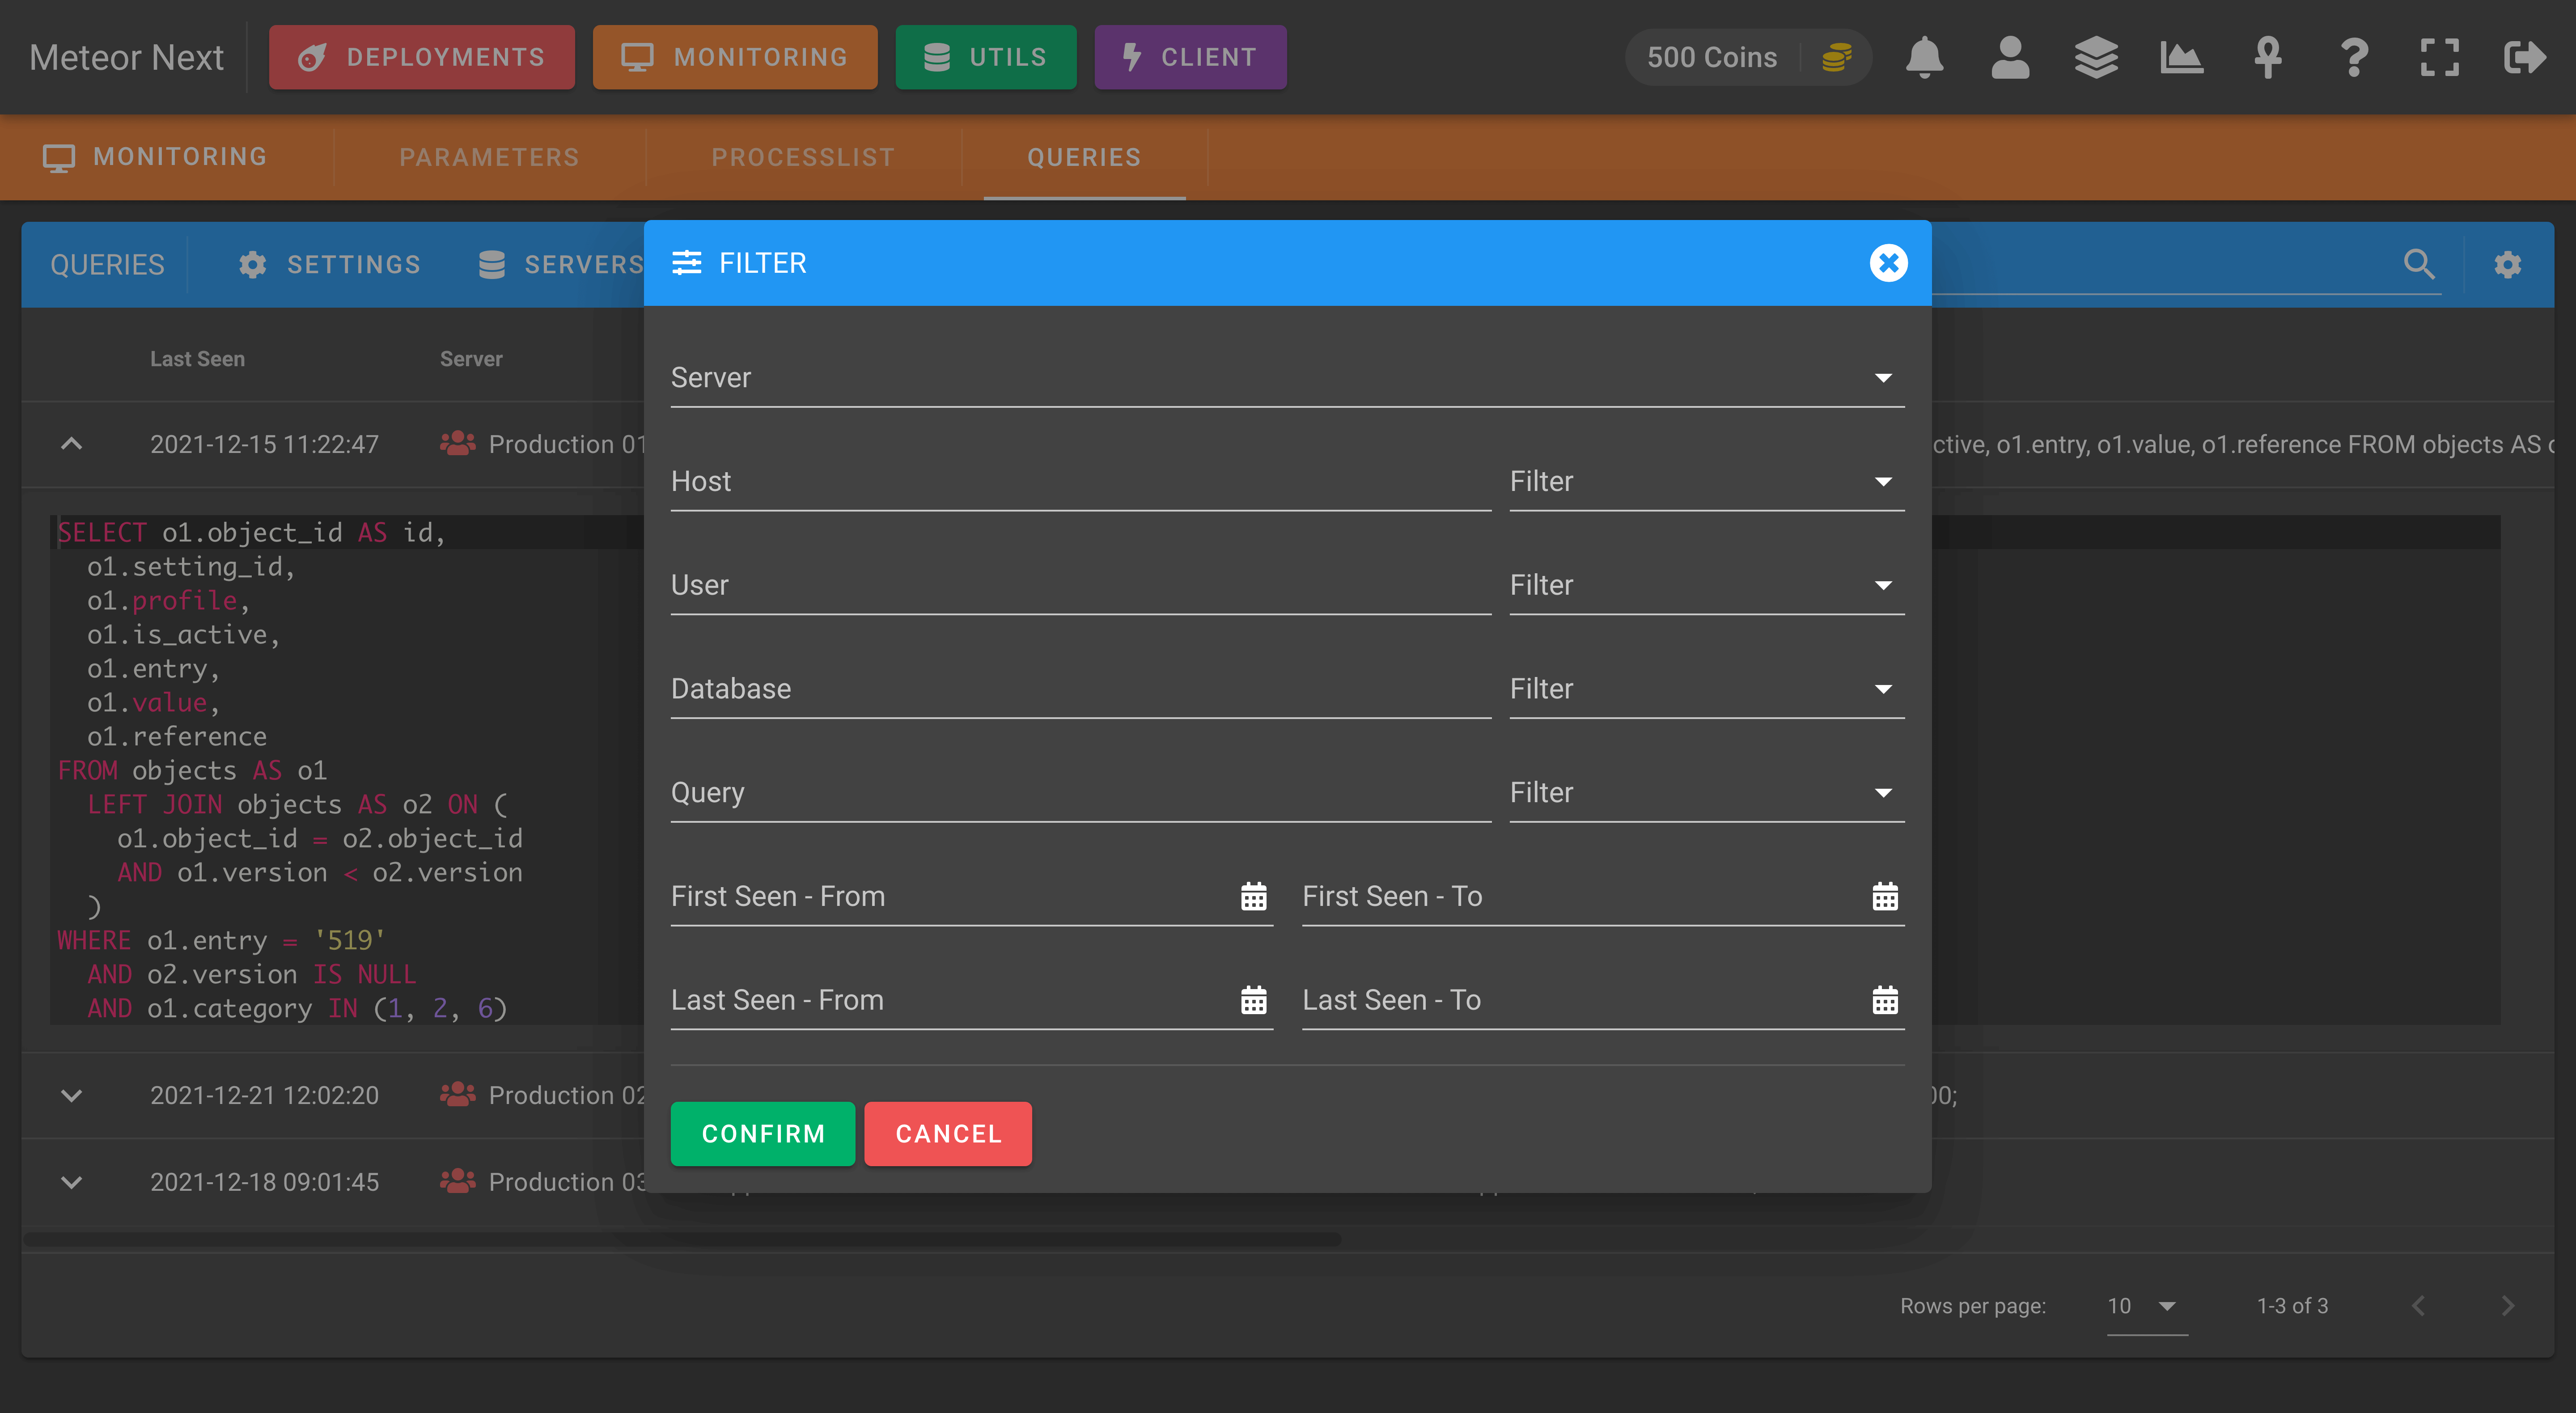
FILTER
This option is used to filter the slow queries in the list.
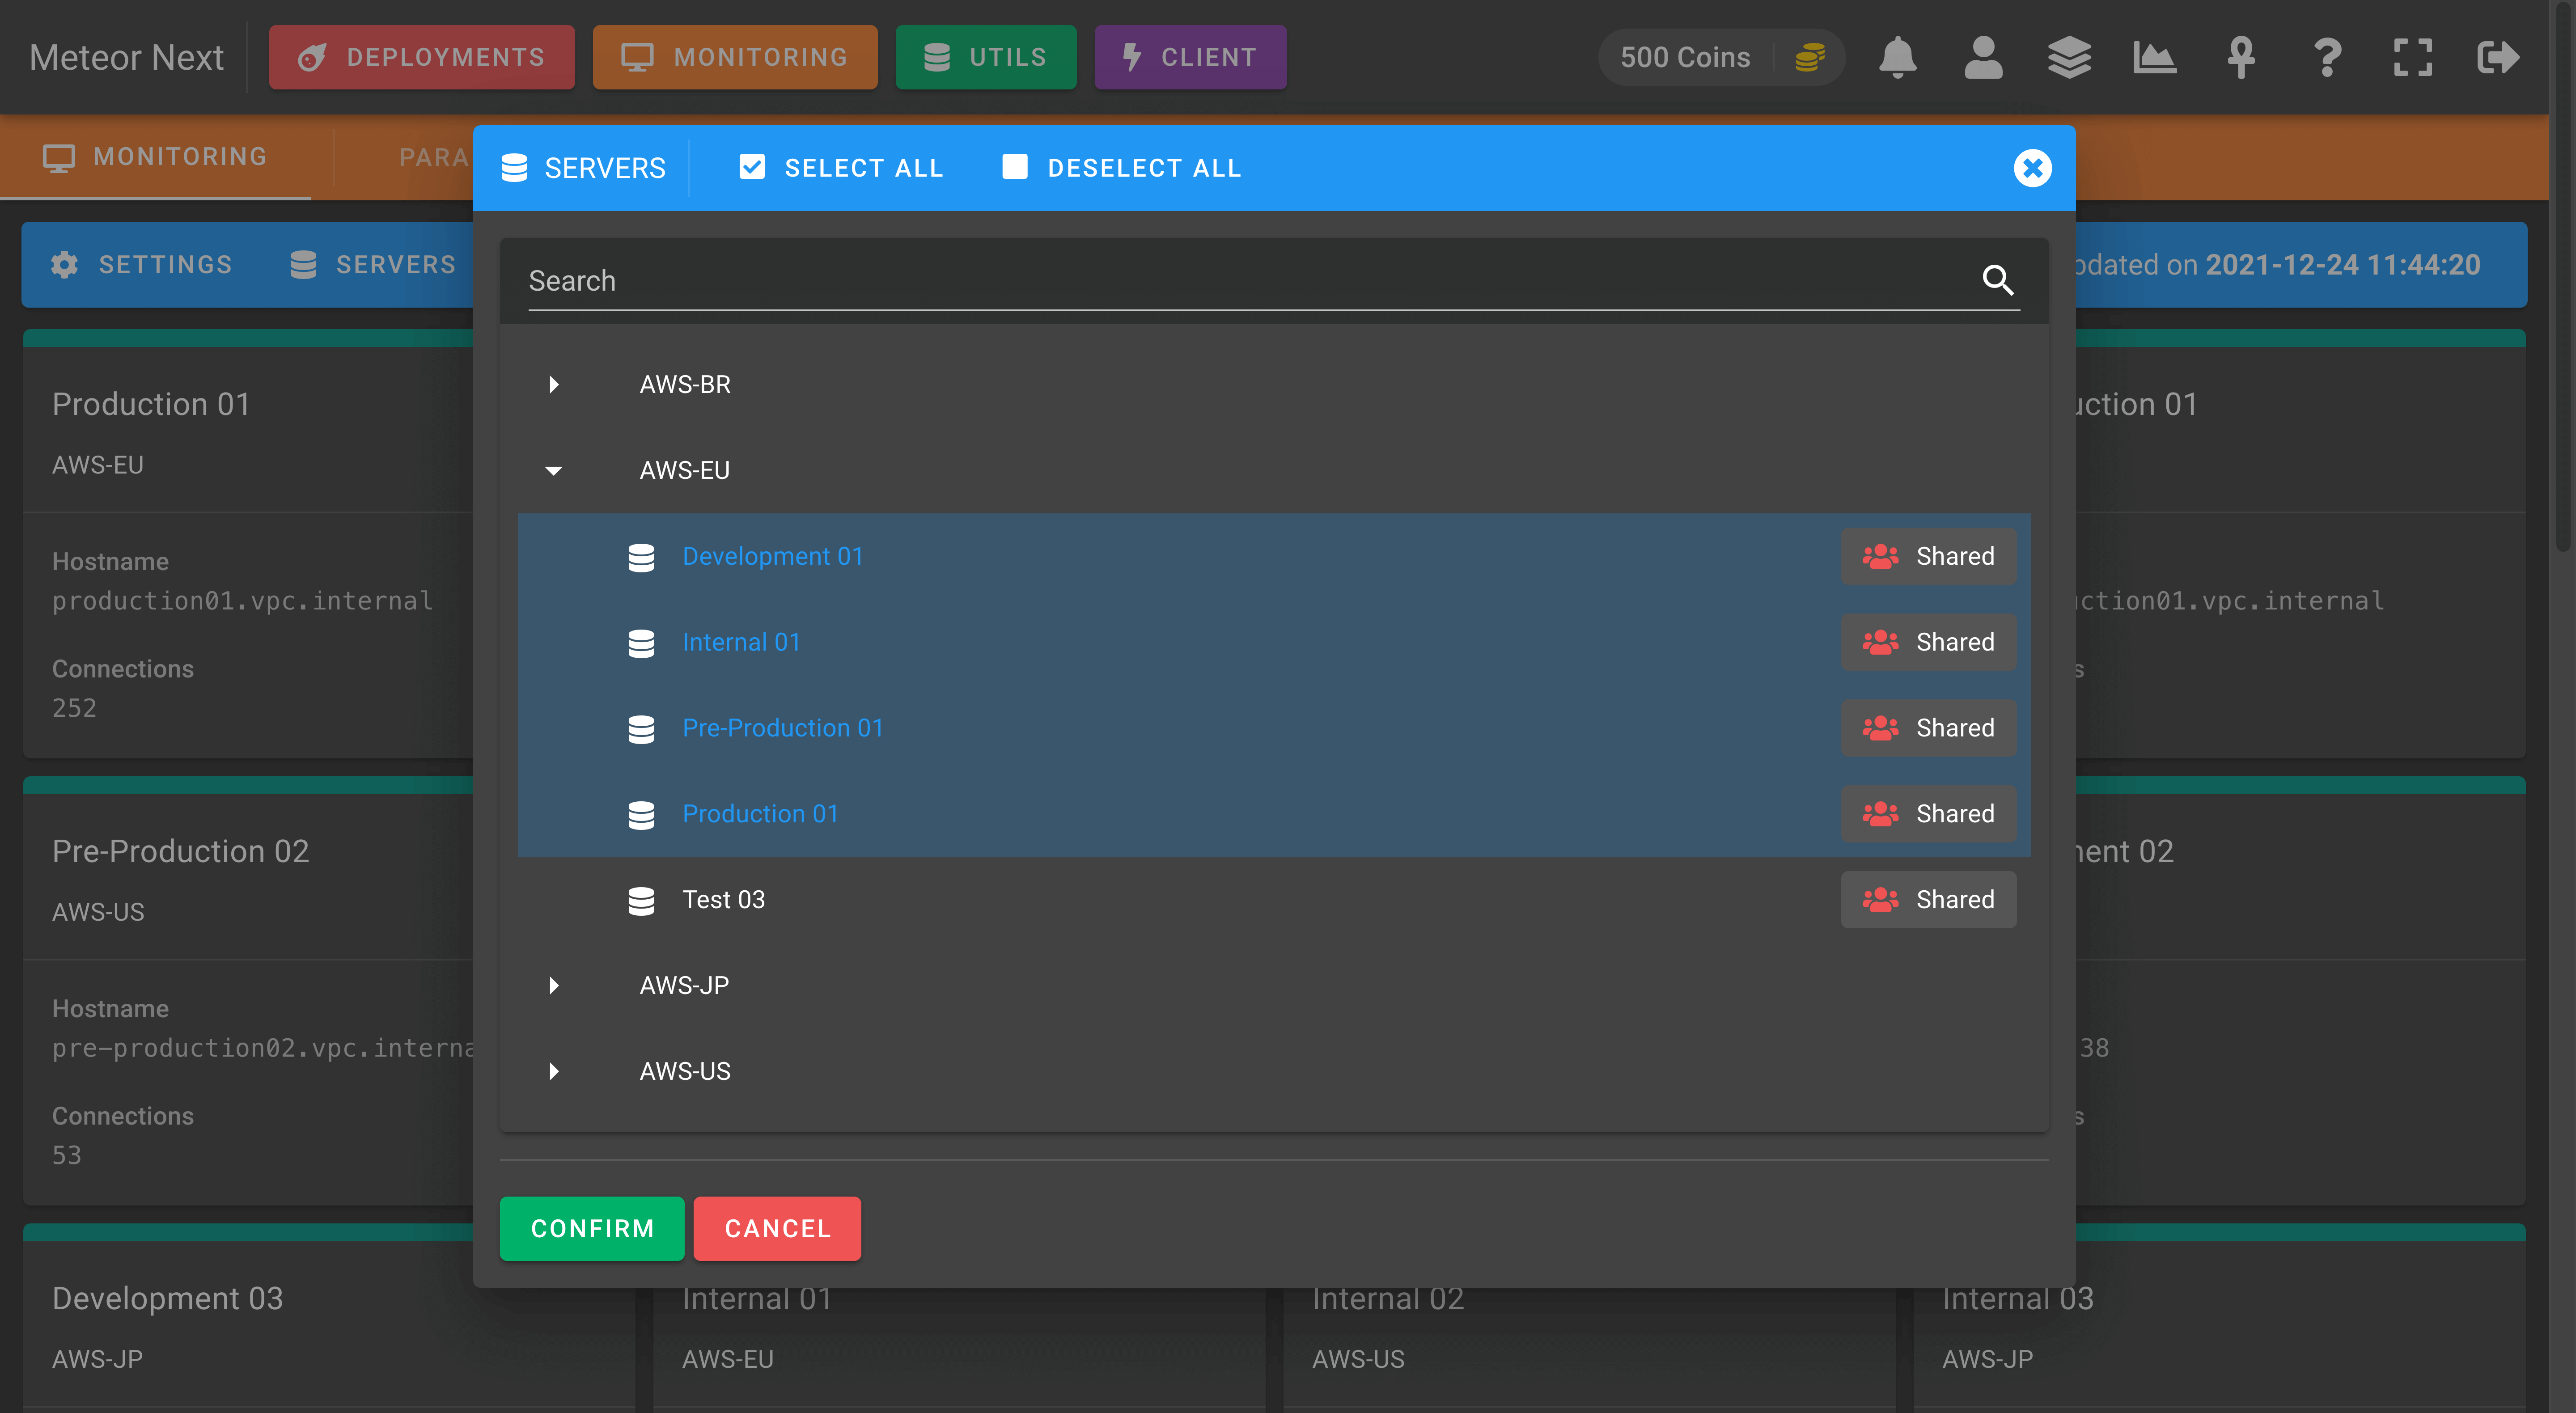
COLUMNS
Here, we can choose which columns we want to display or hide.
